7712 Tuscany Ln Willard, MO 65781
Estimated Value: $357,000 - $430,000
3
Beds
3
Baths
2,056
Sq Ft
$195/Sq Ft
Est. Value
About This Home
This home is located at 7712 Tuscany Ln, Willard, MO 65781 and is currently estimated at $401,126, approximately $195 per square foot. 7712 Tuscany Ln is a home located in Greene County with nearby schools including Willard East Elementary School, Willard Intermediate School North, and Willard High School.
Ownership History
Date
Name
Owned For
Owner Type
Purchase Details
Closed on
Nov 19, 2018
Sold by
Sharon Jamie and Sharon Sarah
Bought by
Sparks Brandon and Sparks Renee
Current Estimated Value
Home Financials for this Owner
Home Financials are based on the most recent Mortgage that was taken out on this home.
Original Mortgage
$28,200
Interest Rate
4.7%
Mortgage Type
Future Advance Clause Open End Mortgage
Purchase Details
Closed on
Oct 1, 2015
Sold by
Fannie Mae
Bought by
Sparks Brandon M and Sparks Renee A
Home Financials for this Owner
Home Financials are based on the most recent Mortgage that was taken out on this home.
Original Mortgage
$167,902
Interest Rate
3.87%
Mortgage Type
FHA
Purchase Details
Closed on
Jul 20, 2007
Sold by
Cleveland Michael and Cleveland Melia
Bought by
Thomas Wesley A
Home Financials for this Owner
Home Financials are based on the most recent Mortgage that was taken out on this home.
Original Mortgage
$192,600
Interest Rate
6.71%
Mortgage Type
New Conventional
Create a Home Valuation Report for This Property
The Home Valuation Report is an in-depth analysis detailing your home's value as well as a comparison with similar homes in the area
Home Values in the Area
Average Home Value in this Area
Purchase History
| Date | Buyer | Sale Price | Title Company |
|---|---|---|---|
| Sparks Brandon | -- | None Available | |
| Sparks Brandon M | -- | Continental Title | |
| Thomas Wesley A | -- | None Available |
Source: Public Records
Mortgage History
| Date | Status | Borrower | Loan Amount |
|---|---|---|---|
| Closed | Sparks Brandon | $28,200 | |
| Previous Owner | Sparks Brandon M | $167,902 | |
| Previous Owner | Thomas Wesley A | $192,600 |
Source: Public Records
Tax History Compared to Growth
Tax History
| Year | Tax Paid | Tax Assessment Tax Assessment Total Assessment is a certain percentage of the fair market value that is determined by local assessors to be the total taxable value of land and additions on the property. | Land | Improvement |
|---|---|---|---|---|
| 2025 | $2,457 | $47,440 | $9,500 | $37,940 |
| 2024 | $2,457 | $42,710 | $7,600 | $35,110 |
| 2023 | $2,448 | $42,710 | $7,600 | $35,110 |
| 2022 | $2,080 | $37,180 | $7,600 | $29,580 |
| 2021 | $2,080 | $37,180 | $7,600 | $29,580 |
| 2020 | $2,007 | $35,250 | $7,600 | $27,650 |
| 2019 | $1,996 | $35,250 | $7,600 | $27,650 |
| 2018 | $1,969 | $34,410 | $7,600 | $26,810 |
| 2017 | $1,954 | $33,480 | $7,600 | $25,880 |
| 2016 | $1,891 | $33,480 | $7,600 | $25,880 |
| 2015 | $1,877 | $33,480 | $7,600 | $25,880 |
| 2014 | $1,815 | $32,110 | $7,600 | $24,510 |
Source: Public Records
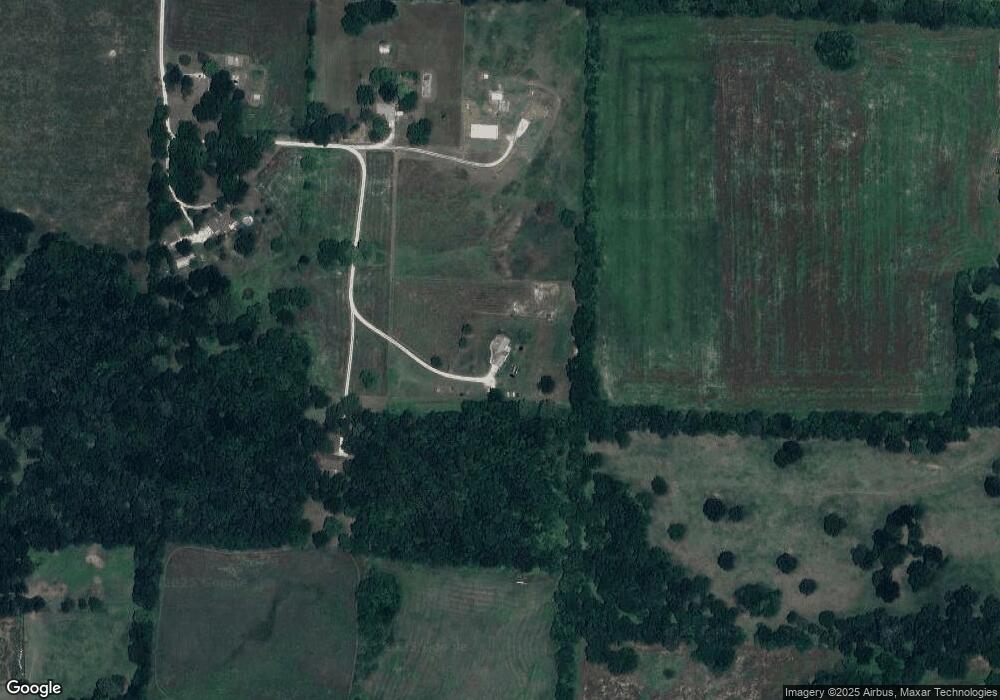
Map
Nearby Homes
- 000 N Farm Road 91
- 515 N Stella Ct
- 513 N Stella Ct
- 508 N Stella Ct
- 403 E Wright St
- 313 Deer Run
- 307 Wren Rd
- 105 Deer Run
- 113 Holly Ridge Rd
- 209 Sparrow Ln
- 6276 N Alan Ave
- 197 Meadowlark
- 6227 Alan Ave
- 121 N Langston St
- 7181 N Farm Road 105
- 206 Cherry Ln
- 99 Kime St
- 108 W Robberson St
- 8467 W Placer Ln
- 000 W Placer Ln
- 7712 Tuscany Ln
- 7712 N Tuscany Ln
- 7857 N Farm Road 93
- 7683 Tuscany Ln
- 7786 Tuscany Ln
- 7786 Tuscany Ln
- 7830 N Farm Road 93
- 7888 N Farm Road 93
- 7884 N Farm Road 93
- 0 Farm Rd 93 Unit 10802979
- 0 Farm Rd 93 Unit 10802980
- 0 Farm Rd 93 Unit 10802978
- 0 Farm Rd 93 Unit 11013715
- 0 Farm Rd 93 Unit 11013712
- 0 Farm Rd 93 Unit 11101805
- 0 Farm Rd 93 Unit 11303496
- 7684 N Farm Road 91
- 7565 N Farm Road 91
- 7997 N Farm Road 93
- 7678 N Farm Road 91