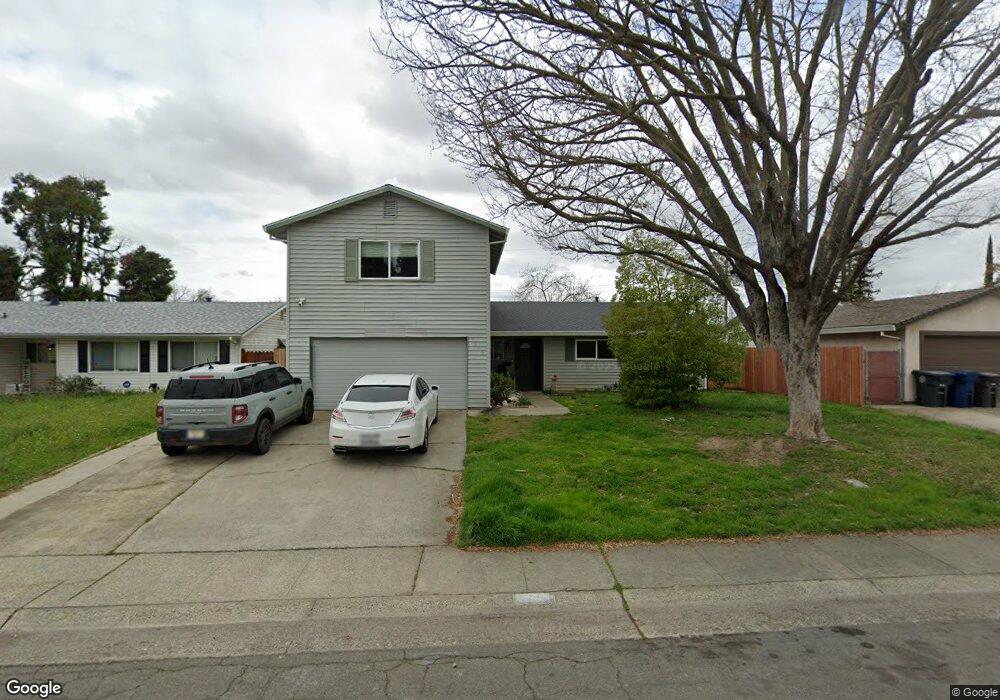
7713 Bierston St Citrus Heights, CA 95621
Estimated Value: $146,000 - $501,000
4
Beds
2
Baths
1,589
Sq Ft
$247/Sq Ft
Est. Value
About This Home
This home is located at 7713 Bierston St, Citrus Heights, CA 95621 and is currently estimated at $392,080, approximately $246 per square foot. 7713 Bierston St is a home located in Sacramento County with nearby schools including Grand Oaks Elementary School, Sylvan Middle School, and Mesa Verde High School.
Ownership History
Date
Name
Owned For
Owner Type
Purchase Details
Closed on
Apr 24, 2019
Sold by
Buccola Robert A
Bought by
Nicksam Properties Llc
Current Estimated Value
Purchase Details
Closed on
May 31, 2009
Sold by
Nicksam Properties Llc
Bought by
Buccola Robert A
Purchase Details
Closed on
Mar 23, 2009
Sold by
Aurora Loan Services Llc
Bought by
Nicksam Properties Llc
Purchase Details
Closed on
Jan 28, 2009
Sold by
Group Charles D and Group Muriel E
Bought by
Aurora Loan Services
Purchase Details
Closed on
Jul 2, 1998
Sold by
Shaner William M and Shaner Kelita K
Bought by
Group Charles D and Group Muriel E
Purchase Details
Closed on
Feb 21, 1997
Sold by
Deville Flossie A
Bought by
Shaner William M and Shaner Kelita K
Purchase Details
Closed on
Jun 6, 1995
Sold by
Fa Deville Flossie A and Fa Flossie A Deville Revocable
Bought by
Shaner William M and Shaner Kelita K
Create a Home Valuation Report for This Property
The Home Valuation Report is an in-depth analysis detailing your home's value as well as a comparison with similar homes in the area
Home Values in the Area
Average Home Value in this Area
Purchase History
| Date | Buyer | Sale Price | Title Company |
|---|---|---|---|
| Nicksam Properties Llc | -- | None Available | |
| Buccola Robert A | -- | Stewart Title Of Sacramento | |
| Nicksam Properties Llc | $129,000 | North American Title Company | |
| Aurora Loan Services | $295,308 | Accommodation | |
| Group Charles D | $128,000 | Fidelity National Title Co | |
| Shaner William M | -- | -- | |
| Shaner William M | -- | Old Republic Title Company |
Source: Public Records
Tax History Compared to Growth
Tax History
| Year | Tax Paid | Tax Assessment Tax Assessment Total Assessment is a certain percentage of the fair market value that is determined by local assessors to be the total taxable value of land and additions on the property. | Land | Improvement |
|---|---|---|---|---|
| 2025 | $1,981 | $166,101 | $109,450 | $56,651 |
| 2024 | $1,981 | $162,845 | $107,304 | $55,541 |
| 2023 | $1,931 | $159,652 | $105,200 | $54,452 |
| 2022 | $1,921 | $156,523 | $103,138 | $53,385 |
| 2021 | $1,890 | $153,455 | $101,116 | $52,339 |
| 2020 | $1,855 | $151,883 | $100,080 | $51,803 |
| 2019 | $1,818 | $148,906 | $98,118 | $50,788 |
| 2018 | $1,798 | $145,988 | $96,195 | $49,793 |
| 2017 | $1,780 | $143,126 | $94,309 | $48,817 |
| 2016 | $1,664 | $140,320 | $92,460 | $47,860 |
| 2015 | $1,636 | $138,214 | $91,072 | $47,142 |
| 2014 | $1,602 | $135,508 | $89,289 | $46,219 |
Source: Public Records
Map
Nearby Homes
- 7716 Las Lilas Ct
- 6112 Ledgewood Way
- 7600 Golden Eye Ln Unit 43
- 6020 Cackler Ln
- 7449 Mar Vista Way
- 6008 Cackler Ln Unit 88
- 7516 Scaup Ln
- 5947 Woodglade Ave
- 7439 Saybrook Dr
- 6007 Birchglade Way
- 7533 Pintail Cir
- 5922 Cackler Ln Unit 83
- 6501 Navion Dr
- 5956 Birchglade Way
- 6301 Autumn Oak Ct
- 7633 Wood Duck Ln Unit 67
- 6721 Navion Dr
- 7956 Brockwood Way
- 6508 Skylane Dr
- 7401 Springvale Way
- 7719 Bierston St
- 7707 Bierston St
- 6201 Pinecreek Way
- 6159 Pinecreek Way
- 7701 Bierston St
- 6236 Rumford Ave
- 6224 Rumford Ave
- 7712 Bierston St
- 7718 Bierston St
- 7706 Bierston St
- 6209 Pinecreek Way
- 6212 Rumford Ave
- 7641 Bierston St
- 7700 Bierston St
- 7724 Bierston St
- 6149 Pinecreek Way
- 6211 Pinecreek Way
- 6200 Rumford Ave
- 7735 Quincewood Cir
- 7730 Bierston St