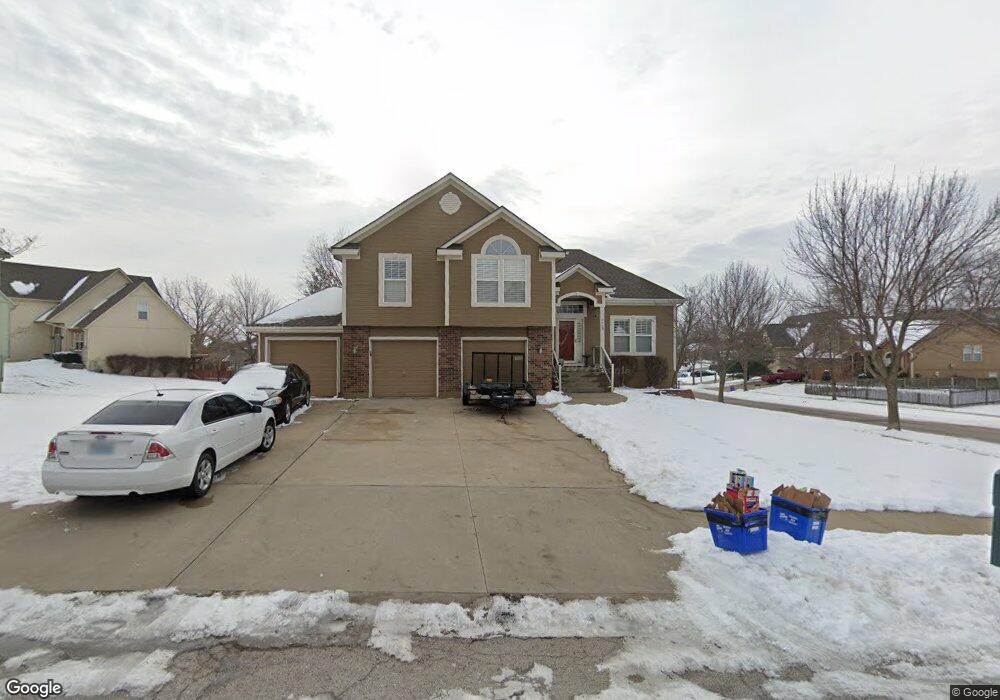
7713 Breckenridge Ave Kansas City, MO 64139
Little Blue Valley NeighborhoodEstimated Value: $400,000 - $470,286
3
Beds
3
Baths
1,780
Sq Ft
$245/Sq Ft
Est. Value
About This Home
This home is located at 7713 Breckenridge Ave, Kansas City, MO 64139 and is currently estimated at $436,322, approximately $245 per square foot. 7713 Breckenridge Ave is a home located in Jackson County with nearby schools including Bernard C. Campbell Middle School, Hazel Grove Elementary School, and Lee's Summit North High School.
Ownership History
Date
Name
Owned For
Owner Type
Purchase Details
Closed on
Dec 17, 2021
Sold by
Cuington Ronalda V and Cuington Lawrence R
Bought by
Cuington Ronalda V and Cuington Lawrence R
Current Estimated Value
Home Financials for this Owner
Home Financials are based on the most recent Mortgage that was taken out on this home.
Original Mortgage
$301,409
Outstanding Balance
$276,731
Interest Rate
2.98%
Mortgage Type
VA
Estimated Equity
$159,591
Purchase Details
Closed on
Jun 21, 2005
Sold by
Manney Harold
Bought by
Cole Manney Ronalda
Purchase Details
Closed on
Aug 8, 1997
Sold by
Strother Investment Properties
Bought by
Spurck Construction Inc
Home Financials for this Owner
Home Financials are based on the most recent Mortgage that was taken out on this home.
Original Mortgage
$142,400
Interest Rate
7.6%
Mortgage Type
Construction
Create a Home Valuation Report for This Property
The Home Valuation Report is an in-depth analysis detailing your home's value as well as a comparison with similar homes in the area
Home Values in the Area
Average Home Value in this Area
Purchase History
| Date | Buyer | Sale Price | Title Company |
|---|---|---|---|
| Cuington Ronalda V | -- | Stewart Title Company | |
| Cole Manney Ronalda | -- | -- | |
| Spurck Construction Inc | -- | -- |
Source: Public Records
Mortgage History
| Date | Status | Borrower | Loan Amount |
|---|---|---|---|
| Open | Cuington Ronalda V | $301,409 | |
| Previous Owner | Spurck Construction Inc | $142,400 |
Source: Public Records
Tax History Compared to Growth
Tax History
| Year | Tax Paid | Tax Assessment Tax Assessment Total Assessment is a certain percentage of the fair market value that is determined by local assessors to be the total taxable value of land and additions on the property. | Land | Improvement |
|---|---|---|---|---|
| 2025 | $5,529 | $62,567 | $8,791 | $53,776 |
| 2024 | $5,471 | $74,091 | $7,727 | $66,364 |
| 2023 | $5,471 | $74,091 | $11,457 | $62,634 |
| 2022 | $3,948 | $47,310 | $5,586 | $41,724 |
| 2021 | $4,030 | $47,310 | $5,586 | $41,724 |
| 2020 | $3,875 | $44,966 | $5,586 | $39,380 |
| 2019 | $3,730 | $44,966 | $5,586 | $39,380 |
| 2018 | $926,639 | $43,400 | $6,770 | $36,630 |
| 2017 | $3,822 | $43,400 | $6,770 | $36,630 |
| 2016 | $3,750 | $42,313 | $6,973 | $35,340 |
| 2014 | $3,601 | $39,930 | $6,503 | $33,427 |
Source: Public Records
Map
Nearby Homes
- 7709 Brook Ln
- 16109 E 76th St
- 16104 E 76th St
- 324 NW Bradford St
- 3516 NW Primrose Ln
- 3508 NW Winding Woods Dr
- 3802 NW Lake Dr
- 3845 NW Cimarron St
- 3608 NW Blue Jacket Dr
- 202 NW Redwood Ct
- 201 NW Redwood Ct
- 312 NW Locust St
- 221 NW Aspen Ct
- 215 NW Aspen St
- 220 NW Aspen St
- 3905 NE Beechwood Dr
- 203 NE Shoreview Dr
- 3743 NE Woodland Ct
- 8700 Trail Ridge St
- 4535 NW Bramble Trail
- 16004 E 77th Terrace
- 7715 Breckenridge Ave
- 7709 Breckenridge Ave
- 15920 E 77th Terrace
- 16100 E 77th Terrace
- 16005 E 77th Terrace
- 16100 E 77th Terrace
- 16104 E 77th Terrace
- 7708 Breckenridge Ave
- 7716 Breckenridge Ave
- 16009 E 77th Terrace
- 7717 Breckenridge Ave
- 7707 Breckenridge Ave
- 16108 E 77th Terrace
- 16108 E 77th Terrace
- 7718 Breckenridge Ave
- 7703 Breckenridge Ave
- 16015 E 77th Terrace
- 7705 Breckenridge Ave
- 7704 Breckenridge Ave