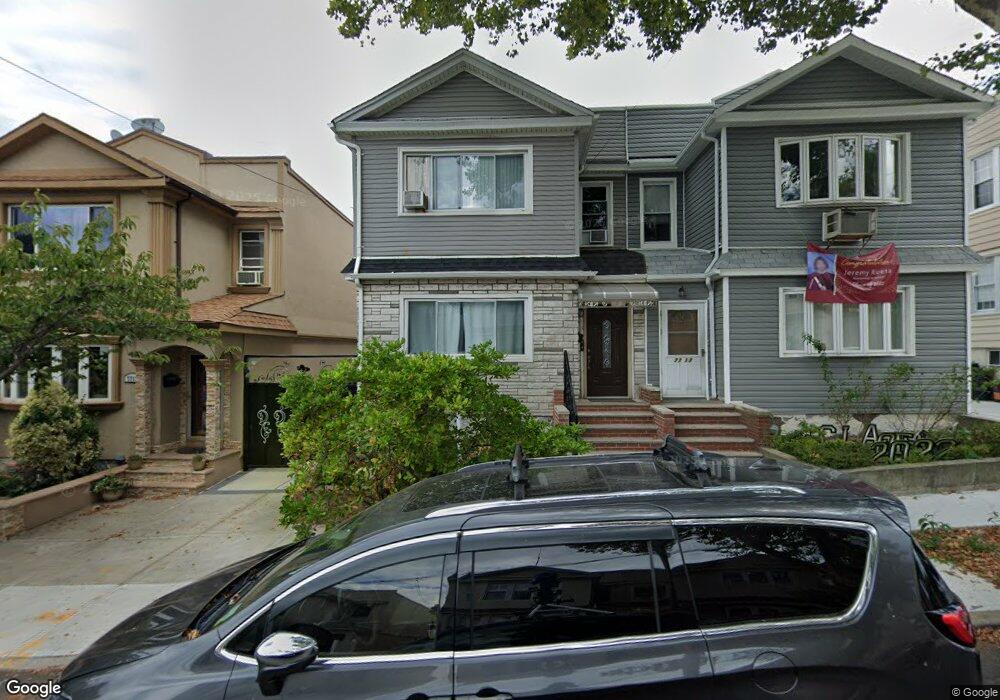
7715 64th St Ridgewood, NY 11385
Glendale NeighborhoodEstimated Value: $973,000 - $1,141,000
Studio
--
Bath
2,280
Sq Ft
$463/Sq Ft
Est. Value
About This Home
This home is located at 7715 64th St, Ridgewood, NY 11385 and is currently estimated at $1,056,707, approximately $463 per square foot. 7715 64th St is a home located in Queens County with nearby schools including P.S. 91 - Richard Arkwright, Joseph F. Quinn Intermediate School 77, and Elm Community Charter School.
Ownership History
Date
Name
Owned For
Owner Type
Purchase Details
Closed on
Apr 21, 2006
Sold by
Fernandes Hilda
Bought by
Campoverde Angela and Campoverde Galo
Current Estimated Value
Home Financials for this Owner
Home Financials are based on the most recent Mortgage that was taken out on this home.
Original Mortgage
$67,932
Outstanding Balance
$38,777
Interest Rate
6.34%
Estimated Equity
$1,017,930
Purchase Details
Closed on
Aug 20, 1999
Sold by
Garcia James and Medina Octavio
Bought by
Fernandes Hilda
Home Financials for this Owner
Home Financials are based on the most recent Mortgage that was taken out on this home.
Original Mortgage
$170,000
Interest Rate
8.1%
Purchase Details
Closed on
Apr 4, 1997
Sold by
Distefano Martin and Cuciniello Angela
Bought by
Garcia James and Medina Octavio
Home Financials for this Owner
Home Financials are based on the most recent Mortgage that was taken out on this home.
Original Mortgage
$171,000
Interest Rate
7.88%
Create a Home Valuation Report for This Property
The Home Valuation Report is an in-depth analysis detailing your home's value as well as a comparison with similar homes in the area
Home Values in the Area
Average Home Value in this Area
Purchase History
| Date | Buyer | Sale Price | Title Company |
|---|---|---|---|
| Campoverde Angela | $680,000 | -- | |
| Campoverde Angela | $680,000 | -- | |
| Fernandes Hilda | $270,000 | Lawyers Title Insurance Corp | |
| Fernandes Hilda | $270,000 | Lawyers Title Insurance Corp | |
| Garcia James | $180,000 | Commonwealth Land Title Ins | |
| Garcia James | $180,000 | Commonwealth Land Title Ins |
Source: Public Records
Mortgage History
| Date | Status | Borrower | Loan Amount |
|---|---|---|---|
| Open | Campoverde Angela | $67,932 | |
| Closed | Campoverde Angela | $67,932 | |
| Open | Campoverde Angela | $544,000 | |
| Closed | Campoverde Angela | $544,000 | |
| Previous Owner | Fernandes Hilda | $170,000 | |
| Previous Owner | Garcia James | $171,000 |
Source: Public Records
Map
Nearby Homes
- 647 Cooper Ave
- 7520 64th Place
- 75-16 62nd St
- 78-14 64th Place
- 7817 64th St
- 62-16 80th Ave
- 7818 65th St
- 74-40 65th St
- 60-38 78th Ave
- 7505 60th Place
- 72-34 61st St
- 6027 78th Ave
- 60-27 Saint Felix Ave
- 62-53 80th Rd
- 60-48 80th Ave
- 65 Cooper Square Unit 3C
- 7714 Cypress Hills St
- 6020 Saint Felix Ave
- 64-39 74th Ave
- 8018 64th Ln
- 7717 64th St
- 7713 64th St
- 7721 64th St
- 7723 64th St
- 64-10 Cooper Ave
- 6408 Cooper Ave
- 6406 Cooper Ave
- 64-04 Cooper Ave Unit 2
- 64-04 Cooper Ave Unit 2fl
- 6410 Cooper Ave
- 7716 64th Place
- 7714 64th Place
- 7718 64th Place
- 6404 Cooper Ave
- 7712 64th Place
- 6412 Cooper Ave
- 7720 64th Place
- 77-20 64th Place
- 7722 64th Place
- 6414 Cooper Ave
Your Personal Tour Guide
Ask me questions while you tour the home.