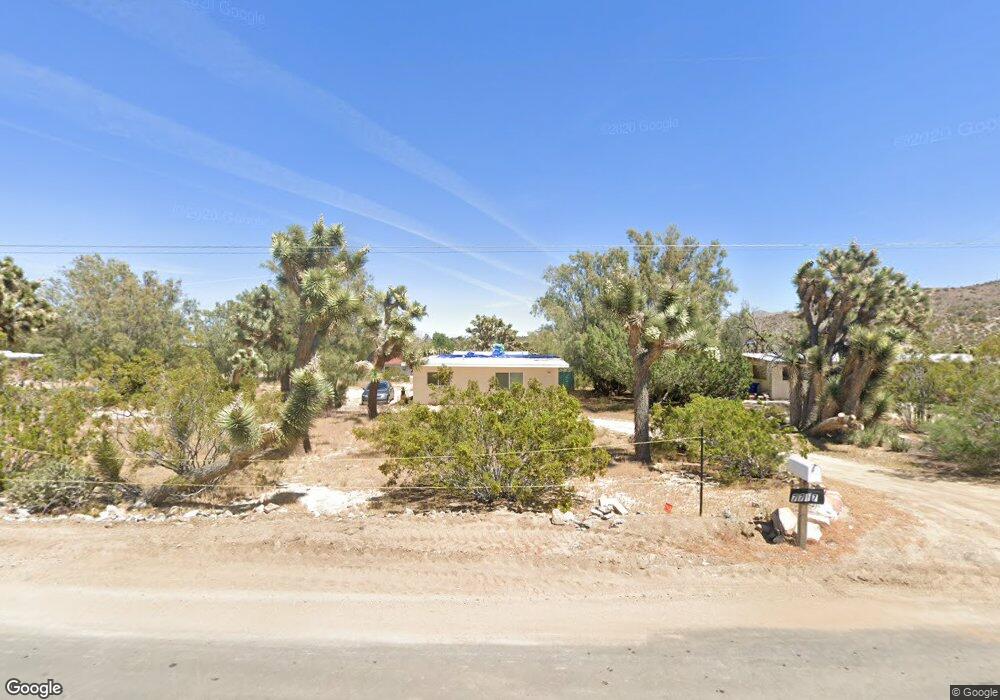
7717 Joshua View Dr Yucca Valley, CA 92284
Estimated Value: $168,000 - $301,000
1
Bed
2
Baths
1,184
Sq Ft
$209/Sq Ft
Est. Value
About This Home
This home is located at 7717 Joshua View Dr, Yucca Valley, CA 92284 and is currently estimated at $247,638, approximately $209 per square foot. 7717 Joshua View Dr is a home located in San Bernardino County with nearby schools including Onaga Elementary School, La Contenta Middle School, and Yucca Valley High School.
Ownership History
Date
Name
Owned For
Owner Type
Purchase Details
Closed on
Feb 25, 2016
Sold by
Aivazian Manaser
Bought by
Aivazian Living Trust and Aivazian
Current Estimated Value
Purchase Details
Closed on
Nov 14, 2013
Sold by
Rodrigues Elisabeth De Matos
Bought by
Aivazian Manaser
Purchase Details
Closed on
Nov 4, 2013
Sold by
Craft Derrelle E and Trust For Leroy Ery 2007 Trust
Bought by
Aivazian Manaser
Purchase Details
Closed on
Aug 27, 2007
Sold by
Ery Leroy R
Bought by
Ery Leroy R and The Leroy Ery 2007 Trust
Purchase Details
Closed on
Nov 15, 2006
Sold by
Platt Wilma L
Bought by
Ery Leroy R
Purchase Details
Closed on
Sep 27, 2006
Sold by
Platt Wilma L
Bought by
Ery Roy R
Purchase Details
Closed on
Dec 9, 2004
Sold by
Platt Wilma L
Bought by
Platt Wilma L and Wilma Platt 2004 Trust
Create a Home Valuation Report for This Property
The Home Valuation Report is an in-depth analysis detailing your home's value as well as a comparison with similar homes in the area
Home Values in the Area
Average Home Value in this Area
Purchase History
| Date | Buyer | Sale Price | Title Company |
|---|---|---|---|
| Aivazian Living Trust | -- | None Listed On Document | |
| Aivazian Manaser | -- | Fidelity National Title Co | |
| Aivazian Manaser | $35,000 | Fidelity National Title Co | |
| Ery Leroy R | -- | None Available | |
| Ery Leroy R | -- | None Available | |
| Platt Wilma L | -- | None Available | |
| Ery Roy R | -- | None Available | |
| Platt Wilma L | -- | -- |
Source: Public Records
Tax History Compared to Growth
Tax History
| Year | Tax Paid | Tax Assessment Tax Assessment Total Assessment is a certain percentage of the fair market value that is determined by local assessors to be the total taxable value of land and additions on the property. | Land | Improvement |
|---|---|---|---|---|
| 2025 | $2,344 | $73,552 | $39,228 | $34,324 |
| 2024 | $2,344 | $72,110 | $38,459 | $33,651 |
| 2023 | $2,125 | $70,696 | $37,705 | $32,991 |
| 2022 | $1,478 | $69,310 | $36,966 | $32,344 |
| 2021 | $1,598 | $67,951 | $36,241 | $31,710 |
| 2020 | $1,685 | $67,254 | $35,869 | $31,385 |
| 2019 | $1,489 | $65,936 | $35,166 | $30,770 |
| 2018 | $1,185 | $64,643 | $34,476 | $30,167 |
| 2017 | $820 | $63,375 | $33,800 | $29,575 |
| 2016 | $805 | $62,132 | $33,137 | $28,995 |
| 2015 | $787 | $61,198 | $32,639 | $28,559 |
| 2014 | $780 | $60,000 | $32,000 | $28,000 |
Source: Public Records
Map
Nearby Homes
- 57613 Onaga Trail
- 57375 Navajo Trail
- 57373 Pueblo Trail
- 8804 Warren Vista Ave
- 8776 Warren Vista Ave
- 7912 Victor Vista
- 7457 Lucerne Vista Ave
- 0 Elata Ave Unit IV25033811
- 7411 Joshua Ln
- 57136 Navajo Trail
- 2333 Bonita Trail
- 57029 Onaga Trail
- 7349 Joshua Ln
- 7625 Hilton Ave
- 5280 Hilton Ave
- 7331 Joshua Ln
- 57007 Navajo Trail
- 7590 Aster Ave
- 58342 Joshua Dr
- 7337 Condalia Ave
- 7737 Joshua View Dr
- 57461 Onaga Trail
- 7745 Joshua View Dr
- 7685 Joshua View Dr
- 57482 Onaga Trail
- 57429 Onaga Trail
- 57492 Onaga Trail
- 57517 Onaga Trail
- 7751 Joshua View Dr
- 57526 Onaga Trail
- 7740 Joshua View Dr
- 57419 Onaga Trail
- 7671 Joshua View Dr
- 57415 Onaga Trail
- 7762 Joshua View Dr
- 57528 Onaga Trail
- 7664 Joshua View Dr
- 7641 Joshua View Dr
- 57547 Onaga Trail
- 57387 Onaga Trail