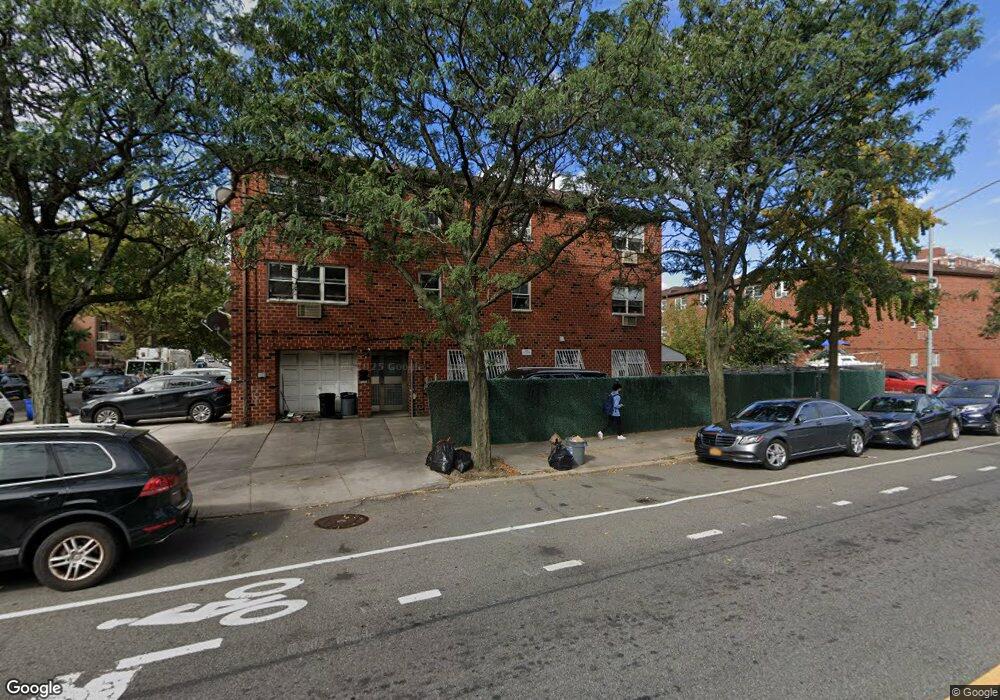
7718 Parsons Blvd Fresh Meadows, NY 11366
Kew Gardens Hills NeighborhoodEstimated Value: $1,565,000 - $1,952,000
--
Bed
--
Bath
3,580
Sq Ft
$478/Sq Ft
Est. Value
About This Home
This home is located at 7718 Parsons Blvd, Fresh Meadows, NY 11366 and is currently estimated at $1,712,000, approximately $478 per square foot. 7718 Parsons Blvd is a home located in Queens County with nearby schools including I.S. 250 - The Robert F. Kennedy Community Middle School.
Ownership History
Date
Name
Owned For
Owner Type
Purchase Details
Closed on
Jul 19, 2018
Sold by
Yang Kang Yan
Bought by
Yang Kang Yan and Zhou Chao Cong
Current Estimated Value
Home Financials for this Owner
Home Financials are based on the most recent Mortgage that was taken out on this home.
Original Mortgage
$675,000
Outstanding Balance
$582,531
Interest Rate
4.5%
Mortgage Type
New Conventional
Estimated Equity
$1,129,469
Purchase Details
Closed on
Jul 26, 2002
Sold by
Chen Jian Ming
Bought by
Yang Kang Yan
Home Financials for this Owner
Home Financials are based on the most recent Mortgage that was taken out on this home.
Original Mortgage
$320,000
Interest Rate
6.39%
Purchase Details
Closed on
Feb 6, 2001
Sold by
Hwang Yu Tsang and Hwang Rene L
Bought by
Chen Jian Ming
Home Financials for this Owner
Home Financials are based on the most recent Mortgage that was taken out on this home.
Original Mortgage
$330,000
Interest Rate
6.89%
Create a Home Valuation Report for This Property
The Home Valuation Report is an in-depth analysis detailing your home's value as well as a comparison with similar homes in the area
Home Values in the Area
Average Home Value in this Area
Purchase History
| Date | Buyer | Sale Price | Title Company |
|---|---|---|---|
| Yang Kang Yan | -- | -- | |
| Yang Kang Yan | -- | -- | |
| Yang Kang Yan | -- | -- | |
| Yang Kang Yan | -- | -- | |
| Yang Kang Yan | -- | -- | |
| Yang Kang Yan | -- | -- | |
| Chen Jian Ming | $472,000 | -- | |
| Chen Jian Ming | $472,000 | -- |
Source: Public Records
Mortgage History
| Date | Status | Borrower | Loan Amount |
|---|---|---|---|
| Open | Yang Kang Yan | $675,000 | |
| Closed | Yang Kang Yan | $675,000 | |
| Previous Owner | Yang Kang Yan | $320,000 | |
| Previous Owner | Chen Jian Ming | $330,000 |
Source: Public Records
Tax History Compared to Growth
Tax History
| Year | Tax Paid | Tax Assessment Tax Assessment Total Assessment is a certain percentage of the fair market value that is determined by local assessors to be the total taxable value of land and additions on the property. | Land | Improvement |
|---|---|---|---|---|
| 2025 | $12,651 | $66,764 | $20,301 | $46,463 |
| 2024 | $12,651 | $62,986 | $19,085 | $43,901 |
| 2023 | $12,651 | $62,986 | $16,186 | $46,800 |
| 2022 | $11,633 | $99,240 | $25,980 | $73,260 |
| 2021 | $11,559 | $106,140 | $25,980 | $80,160 |
| 2020 | $11,481 | $106,380 | $25,980 | $80,400 |
| 2019 | $10,687 | $112,380 | $25,980 | $86,400 |
| 2018 | $10,402 | $52,488 | $14,682 | $37,806 |
| 2017 | $9,844 | $49,760 | $17,807 | $31,953 |
| 2016 | $9,075 | $49,760 | $17,807 | $31,953 |
| 2015 | $5,442 | $46,364 | $27,196 | $19,168 |
| 2014 | $5,442 | $43,740 | $28,860 | $14,880 |
Source: Public Records
Map
Nearby Homes
- 153-51 77th Rd
- 158-36 77th Rd
- 158-18 77th Ave
- 153-44 77th Ave
- 15353 77th Ave Unit 3E
- 150-66 78th Ave
- 15315 79th Ave
- 158-16 79th Ave Unit 411n
- 158-16 79th Ave Unit 204N
- 15307 79th Ave
- 15062 77th Ave
- 77-14 162nd St
- 15815 Union Turnpike Unit 2B
- 15205 79th Ave
- 15824 75th Rd
- 160-20 76th Ave
- 150-29 77th Rd
- 160-06 75th Rd Fesh Meadow Unit 3
- 75-22 Parsons Blvd Unit D2
- 150 E 78th St Unit DPH 11B
- 15353 77th Rd
- 15353 77th Rd Unit 3A
- 15351 77th Rd
- 15349 77th Rd Unit 1
- 15349 77th Rd
- 153-49 77 Rd Unit 1
- 15347 77th Rd
- 15358 77th Ave
- 153-43 77th Rd
- 15343 77th Rd
- 15343 77th Rd Unit 1 Fl
- 15343 77th Rd Unit 3 Fl
- 15343 77th Rd
- 15343 77th Rd
- 15356 77th Ave
- 15358 77th Ave
- 15341 77th Rd
- 153-56 77th Ave Unit 1 Floor
- 153-56 77th Ave
- 15341 77th Rd Unit 3