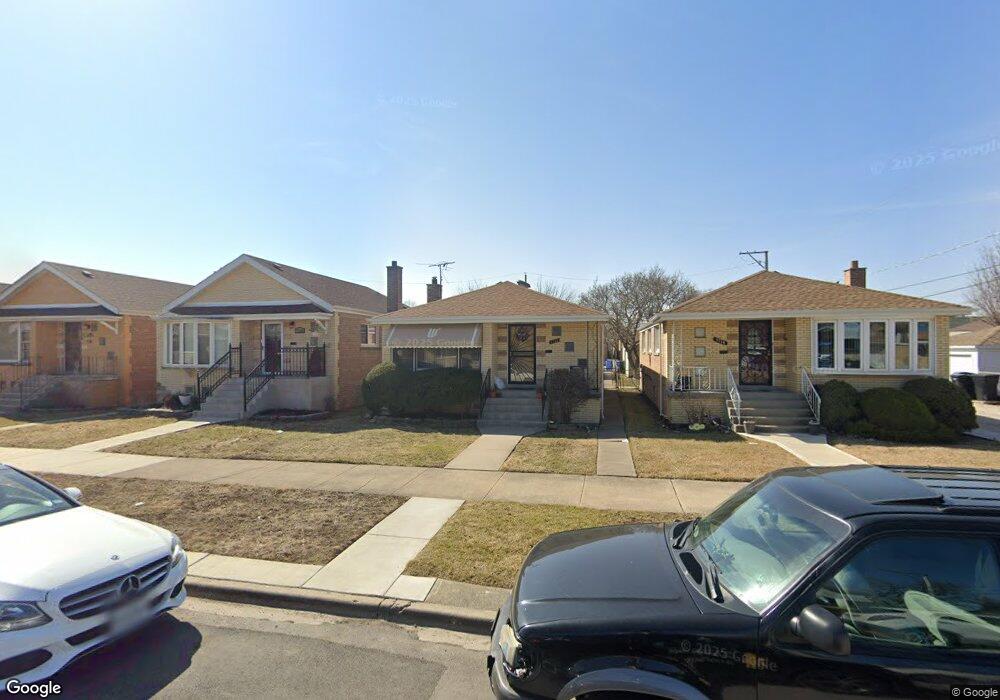
7718 S Albany Ave Chicago, IL 60652
Ashburn NeighborhoodEstimated Value: $258,000 - $307,000
3
Beds
1
Bath
1,022
Sq Ft
$274/Sq Ft
Est. Value
About This Home
This home is located at 7718 S Albany Ave, Chicago, IL 60652 and is currently estimated at $280,336, approximately $274 per square foot. 7718 S Albany Ave is a home located in Cook County with nearby schools including Hampton Elementary Fine & Perf Arts School, Bogan Computer Technical High School, and CICS - Wrightwood.
Ownership History
Date
Name
Owned For
Owner Type
Purchase Details
Closed on
Jul 18, 2011
Sold by
Washington Prentice
Bought by
Washington Prentice and Washington Rose
Current Estimated Value
Home Financials for this Owner
Home Financials are based on the most recent Mortgage that was taken out on this home.
Original Mortgage
$138,400
Outstanding Balance
$95,797
Interest Rate
4.64%
Mortgage Type
New Conventional
Estimated Equity
$184,539
Purchase Details
Closed on
Nov 7, 2000
Sold by
Banks Nolena
Bought by
Washington Prentice
Home Financials for this Owner
Home Financials are based on the most recent Mortgage that was taken out on this home.
Original Mortgage
$88,000
Interest Rate
10.15%
Purchase Details
Closed on
Aug 4, 1995
Sold by
Marquette National Bank
Bought by
Washington Prentice and Banks Nolena
Home Financials for this Owner
Home Financials are based on the most recent Mortgage that was taken out on this home.
Original Mortgage
$72,000
Interest Rate
7.55%
Create a Home Valuation Report for This Property
The Home Valuation Report is an in-depth analysis detailing your home's value as well as a comparison with similar homes in the area
Home Values in the Area
Average Home Value in this Area
Purchase History
| Date | Buyer | Sale Price | Title Company |
|---|---|---|---|
| Washington Prentice | -- | None Available | |
| Washington Prentice | -- | -- | |
| Washington Prentice | $90,000 | -- |
Source: Public Records
Mortgage History
| Date | Status | Borrower | Loan Amount |
|---|---|---|---|
| Open | Washington Prentice | $138,400 | |
| Closed | Washington Prentice | $88,000 | |
| Previous Owner | Washington Prentice | $72,000 |
Source: Public Records
Tax History Compared to Growth
Tax History
| Year | Tax Paid | Tax Assessment Tax Assessment Total Assessment is a certain percentage of the fair market value that is determined by local assessors to be the total taxable value of land and additions on the property. | Land | Improvement |
|---|---|---|---|---|
| 2024 | $2,345 | $20,000 | $2,344 | $17,656 |
| 2023 | $2,247 | $17,000 | $3,125 | $13,875 |
| 2022 | $2,247 | $17,000 | $3,125 | $13,875 |
| 2021 | $988 | $16,999 | $3,124 | $13,875 |
| 2020 | $1,020 | $11,970 | $3,124 | $8,846 |
| 2019 | $1,017 | $13,300 | $3,124 | $10,176 |
| 2018 | $1,002 | $13,300 | $3,124 | $10,176 |
| 2017 | $1,073 | $13,313 | $2,734 | $10,579 |
| 2016 | $1,487 | $13,313 | $2,734 | $10,579 |
| 2015 | $1,430 | $13,313 | $2,734 | $10,579 |
| 2014 | $1,419 | $12,449 | $2,538 | $9,911 |
| 2013 | $1,424 | $12,449 | $2,538 | $9,911 |
Source: Public Records
Map
Nearby Homes
- 7756 S Spaulding Ave
- 7701 S Christiana Ave
- 7809 S Christiana Ave
- 7826 S Christiana Ave
- 7917 S Christiana Ave Unit 1
- 8033 S Kedzie Ave
- 8034 S Sacramento Ave
- 8053 S Kedzie Ave
- 7509 S Trumbull Ave
- 3505 W 77th Place
- 3506 W 78th St
- 7326 S Francisco Ave
- 8118 S Spaulding Ave
- 7249 S Albany Ave
- 3406 W 74th St
- 3534 W 76th St
- 8026 S Fairfield Ave
- 7327 S Mozart St
- 7234 S Sacramento Ave
- 7317 S Mozart St
- 7714 S Albany Ave
- 7720 S Albany Ave
- 7724 S Albany Ave
- 7726 S Albany Ave
- 7730 S Albany Ave
- 3105 W 77th St
- 3109 W 77th St
- 3101 W 77th St
- 3111 W 77th St
- 7719 S Troy St
- 7721 S Troy St
- 7715 S Troy St
- 7725 S Troy St
- 7734 S Albany Ave
- 7727 S Troy St
- 3117 W 77th St
- 7731 S Troy St
- 7736 S Albany Ave
- 7719 S Albany Ave
- 3121 W 77th St