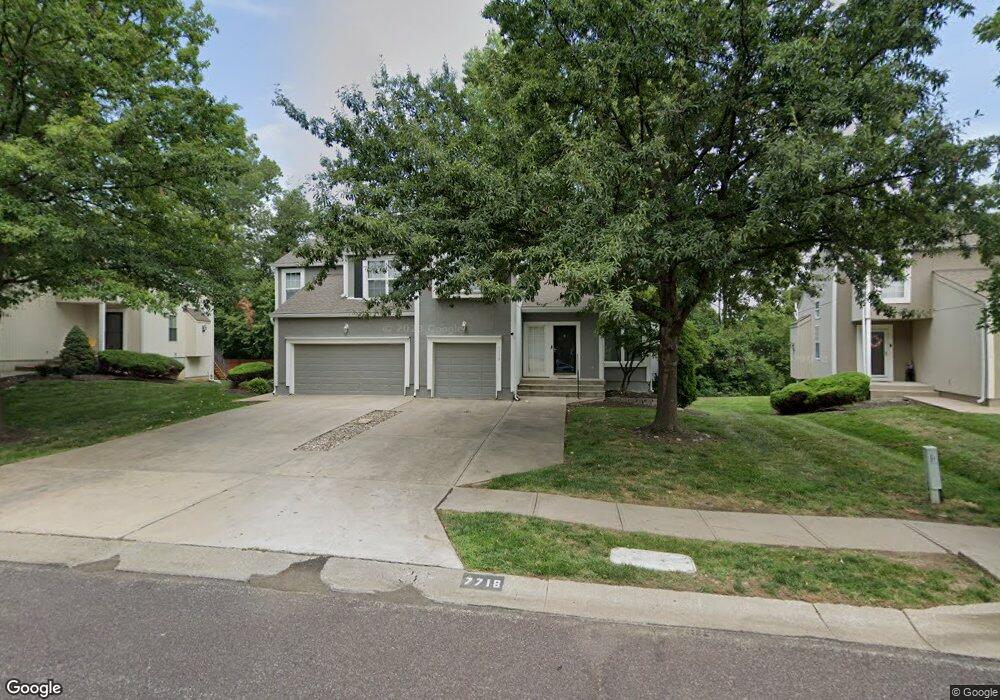
7718 W 148th St Overland Park, KS 66223
South Overland Park NeighborhoodEstimated Value: $477,000 - $609,000
3
Beds
3
Baths
2,736
Sq Ft
$198/Sq Ft
Est. Value
About This Home
This home is located at 7718 W 148th St, Overland Park, KS 66223 and is currently estimated at $542,749, approximately $198 per square foot. 7718 W 148th St is a home located in Johnson County with nearby schools including Lakewood Elementary School, Lakewood Middle School, and Blue Valley West High School.
Ownership History
Date
Name
Owned For
Owner Type
Purchase Details
Closed on
Mar 3, 2014
Sold by
Dowling Terry and Dowling Lisa
Bought by
Dowling Terry and Dowling Lisa
Current Estimated Value
Home Financials for this Owner
Home Financials are based on the most recent Mortgage that was taken out on this home.
Original Mortgage
$140,000
Outstanding Balance
$106,517
Interest Rate
4.44%
Mortgage Type
New Conventional
Estimated Equity
$436,232
Purchase Details
Closed on
Aug 22, 2013
Sold by
Hartley Beverly A and Hartley John W
Bought by
Dowling Terry
Home Financials for this Owner
Home Financials are based on the most recent Mortgage that was taken out on this home.
Original Mortgage
$140,000
Interest Rate
5.5%
Mortgage Type
Purchase Money Mortgage
Purchase Details
Closed on
Jul 1, 2010
Sold by
Ashbrook Partners I L L C
Bought by
Hartley Beverly A and Hartley John W
Create a Home Valuation Report for This Property
The Home Valuation Report is an in-depth analysis detailing your home's value as well as a comparison with similar homes in the area
Home Values in the Area
Average Home Value in this Area
Purchase History
| Date | Buyer | Sale Price | Title Company |
|---|---|---|---|
| Dowling Terry | -- | Professional Title Llc | |
| Dowling Terry | -- | Secured Title Of Kansas City | |
| Hartley Beverly A | -- | Kansas City Title |
Source: Public Records
Mortgage History
| Date | Status | Borrower | Loan Amount |
|---|---|---|---|
| Open | Dowling Terry | $140,000 | |
| Closed | Dowling Terry | $140,000 |
Source: Public Records
Tax History Compared to Growth
Tax History
| Year | Tax Paid | Tax Assessment Tax Assessment Total Assessment is a certain percentage of the fair market value that is determined by local assessors to be the total taxable value of land and additions on the property. | Land | Improvement |
|---|---|---|---|---|
| 2024 | $6,202 | $60,076 | $10,813 | $49,263 |
| 2023 | $6,001 | $57,212 | $10,813 | $46,399 |
| 2022 | $5,815 | $54,452 | $10,813 | $43,639 |
| 2021 | $5,496 | $48,864 | $9,834 | $39,030 |
| 2020 | $5,218 | $46,092 | $7,860 | $38,232 |
| 2019 | $5,118 | $44,252 | $6,056 | $38,196 |
| 2018 | $4,859 | $41,170 | $6,055 | $35,115 |
| 2017 | $4,623 | $38,491 | $6,055 | $32,436 |
| 2016 | $4,372 | $36,363 | $6,055 | $30,308 |
| 2015 | $4,204 | $34,868 | $6,055 | $28,813 |
| 2013 | -- | $30,395 | $6,055 | $24,340 |
Source: Public Records
Map
Nearby Homes
- 14716 Newton St
- 7633 W 148th Terrace
- 7736 W 145th St
- 8111 W 145th Terrace
- 7402 W 145th Terrace
- 8216 W 146th Terrace
- 8300 W 148th St
- 8317 W 144th Place
- 6714 W 148th Terrace
- 8403 W 150th St
- 15021 Broadmoor St
- 14209 Hadley St
- 14927 Riggs St
- 15212 Riley St
- 14708 Walmer St
- 14312 Mackey St
- 14302 Russell St
- 6323 W 145th St
- 14343 Russell St
- 14909 Benson St
- 7720 W 148th St
- 7724 W 148th St
- 7712 W 148th St
- 7726 W 148th St
- 7708 W 148th St
- 7809 W 147th Terrace
- 7805 W 147th Terrace
- 7813 W 147th Terrace
- 7713 W 148th St
- 7715 W 148th St
- 7730 W 148th St
- 7732 W 148th St
- 7709 W 148th St
- 7706 W 148th St
- 7719 W 148th St
- 7817 W 147th Terrace
- 7707 W 148th St
- 7801 W 147th Terrace
- 7721 W 148th St
- 7702 W 148th St