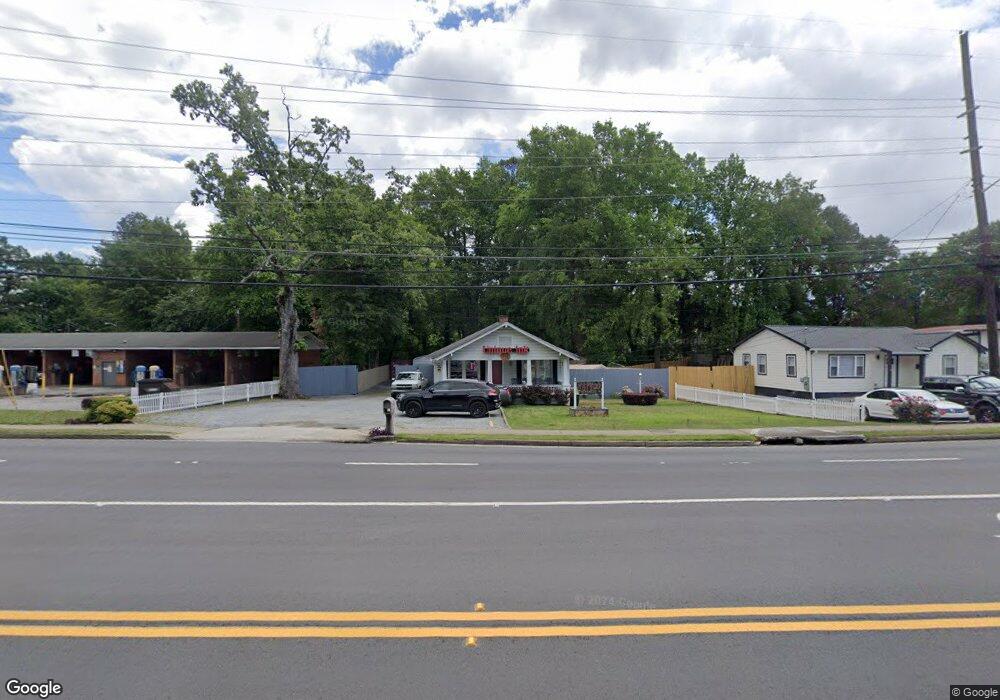
772 Allgood Rd Marietta, GA 30062
Eastern Marietta NeighborhoodEstimated Value: $174,107
2
Beds
1
Bath
1,152
Sq Ft
$151/Sq Ft
Est. Value
About This Home
This home is located at 772 Allgood Rd, Marietta, GA 30062 and is currently estimated at $174,107, approximately $151 per square foot. 772 Allgood Rd is a home located in Cobb County with nearby schools including Sawyer Road Elementary School, Marietta Sixth Grade Academy, and Marietta Middle School.
Ownership History
Date
Name
Owned For
Owner Type
Purchase Details
Closed on
Mar 15, 2011
Sold by
Community Bk Of South
Bought by
Kurashi Danial A
Current Estimated Value
Purchase Details
Closed on
Mar 30, 2007
Sold by
Nell Clair Franklin Moor Trust
Bought by
Djjvdn Props Llc
Home Financials for this Owner
Home Financials are based on the most recent Mortgage that was taken out on this home.
Original Mortgage
$140,948
Interest Rate
6.27%
Mortgage Type
Commercial
Create a Home Valuation Report for This Property
The Home Valuation Report is an in-depth analysis detailing your home's value as well as a comparison with similar homes in the area
Home Values in the Area
Average Home Value in this Area
Purchase History
| Date | Buyer | Sale Price | Title Company |
|---|---|---|---|
| Kurashi Danial A | $62,500 | -- | |
| Djjvdn Props Llc | $137,000 | -- |
Source: Public Records
Mortgage History
| Date | Status | Borrower | Loan Amount |
|---|---|---|---|
| Previous Owner | Djjvdn Props Llc | $140,948 |
Source: Public Records
Tax History Compared to Growth
Tax History
| Year | Tax Paid | Tax Assessment Tax Assessment Total Assessment is a certain percentage of the fair market value that is determined by local assessors to be the total taxable value of land and additions on the property. | Land | Improvement |
|---|---|---|---|---|
| 2025 | $555 | $65,568 | $44,928 | $20,640 |
| 2024 | $555 | $65,568 | $44,928 | $20,640 |
| 2023 | $485 | $57,348 | $39,068 | $18,280 |
| 2022 | $469 | $55,420 | $37,700 | $17,720 |
| 2021 | $393 | $45,700 | $37,700 | $8,000 |
| 2020 | $341 | $39,724 | $32,784 | $6,940 |
| 2019 | $336 | $39,164 | $32,784 | $6,380 |
| 2018 | $336 | $39,164 | $32,784 | $6,380 |
| 2017 | $270 | $39,164 | $32,784 | $6,380 |
| 2016 | $230 | $33,340 | $27,320 | $6,020 |
| 2015 | $250 | $33,340 | $27,320 | $6,020 |
| 2014 | $258 | $33,240 | $27,320 | $5,920 |
Source: Public Records
Map
Nearby Homes
- 770 Mary Ln
- 697 Tom Read Dr
- 600 Creek Water Trail
- 773 Kiowa Dr NE
- 393 Chicopee Dr NE
- 797 Kiowa Dr NE
- 363 Seminole Dr NE
- 812 Caldwell Cir
- 554 Alpine Way
- 230 Alday Ln
- 1603 Glen Ivy
- 630 Etowah Dr NE
- 502 Alpine Way
- 512 Alpine Way
- 447 Birney St NE Unit 449
- 466 Birney St NE
- 454 Birney St NE
- 192 Chicopee Dr NE
- 584 Cherokee St NE
- 149 Bankston Rd