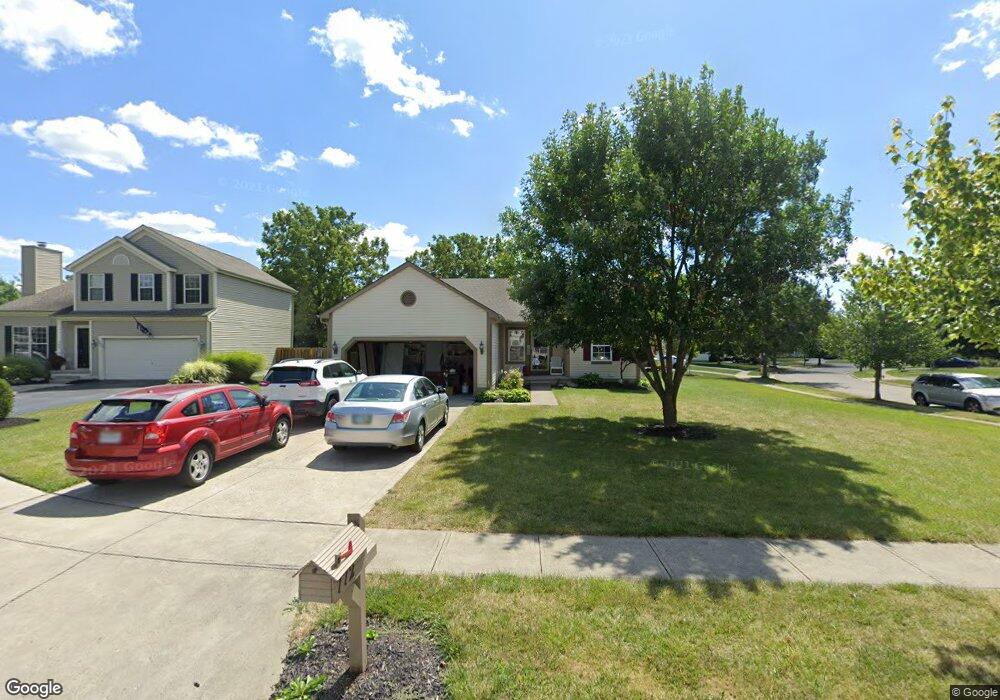
772 Robbins Loop Ct Reynoldsburg, OH 43068
Estimated Value: $304,854 - $344,000
3
Beds
1
Bath
1,272
Sq Ft
$253/Sq Ft
Est. Value
About This Home
This home is located at 772 Robbins Loop Ct, Reynoldsburg, OH 43068 and is currently estimated at $321,214, approximately $252 per square foot. 772 Robbins Loop Ct is a home located in Licking County with nearby schools including Taylor Road Elementary School, Waggoner Road Elementary School, and Waggoner Road Junior High School.
Ownership History
Date
Name
Owned For
Owner Type
Purchase Details
Closed on
Feb 25, 2005
Sold by
Us Bank Na
Bought by
Adams Kimberly
Current Estimated Value
Home Financials for this Owner
Home Financials are based on the most recent Mortgage that was taken out on this home.
Original Mortgage
$107,200
Interest Rate
6.12%
Mortgage Type
Fannie Mae Freddie Mac
Purchase Details
Closed on
Nov 22, 2004
Sold by
Seagraves Erline F
Bought by
Bank One Na and Csfb Mortgage Backed Pass Through Certif
Purchase Details
Closed on
Jul 15, 2002
Sold by
Homewood Corp
Bought by
Seagroves Erline F
Home Financials for this Owner
Home Financials are based on the most recent Mortgage that was taken out on this home.
Original Mortgage
$132,780
Interest Rate
6.82%
Mortgage Type
New Conventional
Create a Home Valuation Report for This Property
The Home Valuation Report is an in-depth analysis detailing your home's value as well as a comparison with similar homes in the area
Home Values in the Area
Average Home Value in this Area
Purchase History
| Date | Buyer | Sale Price | Title Company |
|---|---|---|---|
| Adams Kimberly | $134,000 | -- | |
| Bank One Na | $156,000 | -- | |
| Seagroves Erline F | $165,976 | -- |
Source: Public Records
Mortgage History
| Date | Status | Borrower | Loan Amount |
|---|---|---|---|
| Previous Owner | Adams Kimberly | $107,200 | |
| Previous Owner | Seagroves Erline F | $132,780 | |
| Closed | Adams Kimberly | $26,800 |
Source: Public Records
Tax History Compared to Growth
Tax History
| Year | Tax Paid | Tax Assessment Tax Assessment Total Assessment is a certain percentage of the fair market value that is determined by local assessors to be the total taxable value of land and additions on the property. | Land | Improvement |
|---|---|---|---|---|
| 2024 | $3,443 | $86,000 | $22,750 | $63,250 |
| 2023 | $7,850 | $86,000 | $22,750 | $63,250 |
| 2022 | $3,425 | $66,780 | $17,780 | $49,000 |
| 2021 | $3,423 | $66,780 | $17,780 | $49,000 |
| 2020 | $3,505 | $66,780 | $17,780 | $49,000 |
| 2019 | $3,308 | $54,850 | $12,250 | $42,600 |
| 2018 | $3,329 | $0 | $0 | $0 |
| 2017 | $3,118 | $0 | $0 | $0 |
| 2016 | $3,042 | $0 | $0 | $0 |
| 2015 | $2,944 | $0 | $0 | $0 |
| 2014 | $4,469 | $0 | $0 | $0 |
| 2013 | $3,032 | $0 | $0 | $0 |
Source: Public Records
Map
Nearby Homes
- 8574 Victoria Meadow Ln
- 8774 Ormiston Cir
- 937 Quaint Ct
- 8536 Kingsley Dr
- 875 Briaro St
- 8675 Kingsley Dr
- 1066 Celosia Ct
- 1080 Taylor Mills Dr
- 8889 Betony Ct SW
- 8697 Kingsley Dr
- 8344 Bellow Park Dr
- 926 Hilton Dr
- 8210 Rodebaugh Rd
- 8145 Rhoderick Cir
- 1065 Mastell Dr
- 8228 Kingsley Dr
- 1182 Sanderling Dr Unit 61182
- 8056 Summit Rd SW
- 8482 Taylor Chase Dr
- 1147 Dawn Dr
- 768 Robbins Loop Ct
- 8652 Robbins Loop Dr
- 758 Robbins Loop Ct
- 8645 Robbins Loop Dr
- 8651 Robbins Loop Dr
- 8656 Robbins Loop Dr
- 8641 Robbins Loop Dr
- 769 Robbins Loop Ct
- 8576 Robbins Loop Dr
- 765 Robbins Loop Ct
- 750 Robbins Loop Ct
- 8637 Robbins Loop Dr
- 761 Robbins Loop Ct
- 8655 Robbins Loop Dr
- 8642 Firstgate Dr
- 8633 Robbins Loop Dr
- 8632 Firstgate Dr
- 8622 Firstgate Dr
- 8612 Firstgate Dr
- 8155 Taylor Rd SW