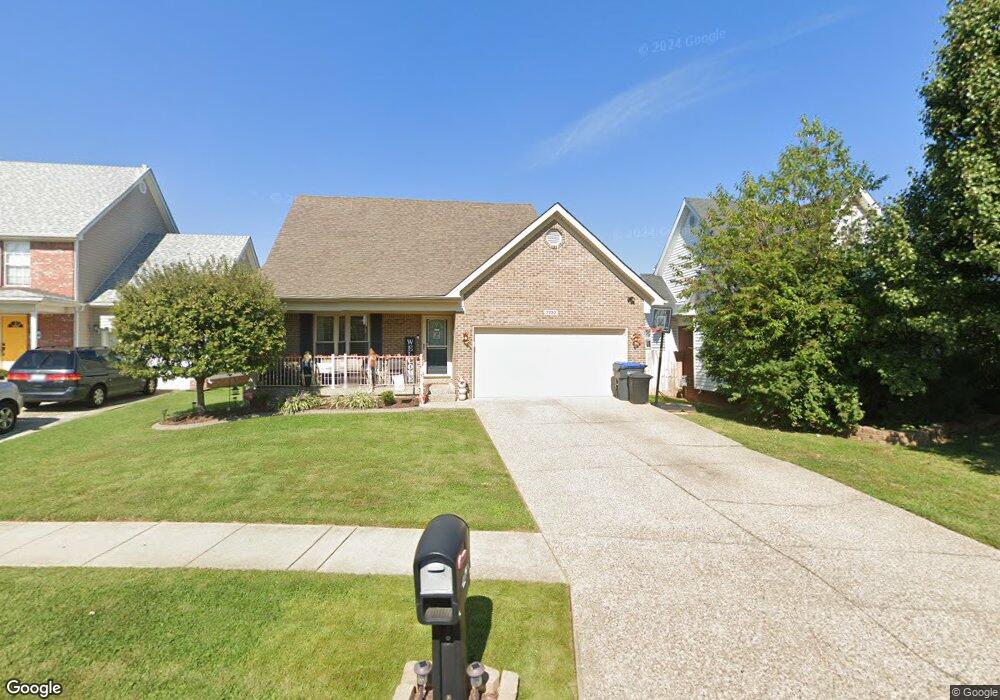
7722 Alyssum Dr Unit L 69 Louisville, KY 40258
Pleasure Ridge Park NeighborhoodEstimated Value: $304,301 - $331,000
3
Beds
2
Baths
1,500
Sq Ft
$213/Sq Ft
Est. Value
About This Home
This home is located at 7722 Alyssum Dr Unit L 69, Louisville, KY 40258 and is currently estimated at $318,825, approximately $212 per square foot. 7722 Alyssum Dr Unit L 69 is a home located in Jefferson County with nearby schools including Shacklette Elementary School, Wilkerson Elementary School, and Greenwood Elementary School.
Ownership History
Date
Name
Owned For
Owner Type
Purchase Details
Closed on
Feb 23, 2018
Sold by
Devine Elizabeth and Devine Justin R
Bought by
Leffler Scott Gene and Leffler Tracy Renae
Current Estimated Value
Purchase Details
Closed on
Mar 5, 2012
Sold by
Deutsche Bank National Trust Company
Bought by
Rasche Elizabeth A and Devine Justin R
Home Financials for this Owner
Home Financials are based on the most recent Mortgage that was taken out on this home.
Original Mortgage
$93,839
Interest Rate
3.95%
Mortgage Type
New Conventional
Purchase Details
Closed on
Dec 20, 2011
Sold by
Lyvers Pam
Bought by
Deutsche Bank National Trust Company
Purchase Details
Closed on
Feb 8, 2006
Sold by
New Horizon Investments Llc
Bought by
Lyvers Pam
Home Financials for this Owner
Home Financials are based on the most recent Mortgage that was taken out on this home.
Original Mortgage
$52,900
Interest Rate
6.14%
Mortgage Type
Seller Take Back
Create a Home Valuation Report for This Property
The Home Valuation Report is an in-depth analysis detailing your home's value as well as a comparison with similar homes in the area
Home Values in the Area
Average Home Value in this Area
Purchase History
| Date | Buyer | Sale Price | Title Company |
|---|---|---|---|
| Leffler Scott Gene | $193,000 | Limestone Title & Escrow Llc | |
| Rasche Elizabeth A | $117,299 | Metro Title | |
| Deutsche Bank National Trust Company | $103,100 | None Available | |
| Lyvers Pam | $167,900 | None Available |
Source: Public Records
Mortgage History
| Date | Status | Borrower | Loan Amount |
|---|---|---|---|
| Previous Owner | Rasche Elizabeth A | $93,839 | |
| Previous Owner | Lyvers Pam | $52,900 |
Source: Public Records
Tax History Compared to Growth
Tax History
| Year | Tax Paid | Tax Assessment Tax Assessment Total Assessment is a certain percentage of the fair market value that is determined by local assessors to be the total taxable value of land and additions on the property. | Land | Improvement |
|---|---|---|---|---|
| 2024 | $3,234 | $277,630 | $23,500 | $254,130 |
| 2023 | $3,326 | $277,630 | $23,500 | $254,130 |
| 2022 | $2,320 | $193,000 | $25,000 | $168,000 |
| 2021 | $2,499 | $193,000 | $25,000 | $168,000 |
| 2020 | $2,233 | $193,000 | $25,000 | $168,000 |
| 2019 | $2,188 | $193,000 | $25,000 | $168,000 |
| 2018 | $1,801 | $160,760 | $25,000 | $135,760 |
| 2017 | $1,687 | $160,760 | $25,000 | $135,760 |
| 2013 | -- | $117,300 | $27,000 | $90,300 |
Source: Public Records
Map
Nearby Homes
- 7711 Bramble Ln
- 5006 Tumeric Ln
- 7801 Mango Dr
- 5007 Lila Ave
- 5008 Greenwood Rd
- 8108 Nancy Ln
- 4824 Cofer Ave
- 5500 Azalea Ln
- 5215 Pyrus Ln
- 5406 Trefoil Ln
- 4908 Greenwood Rd
- 7807 Axtell Ave
- 4902 Greenwood Rd
- 7906 Daffodil Dr
- 7228 Daisy Ave
- 4900 Chismoor Ct
- 5513 Tamarack Ln
- 7107 Gageland Rd
- 5605 Tamarack Ln
- 5202 Rodgers Rd
- 7722 Alyssum Dr
- 7720 Alyssum Dr
- 7800 Alyssum Dr
- 7802 Alyssum Dr
- 7802 Alyssum Dr Unit L 67
- 7717 Hepatica Dr
- 7719 Hepatica Dr
- 7715 Hepatica Dr
- 7715 Hepatica Dr Unit (LOT 45)
- 7804 Alyssum Dr
- 7804 Alyssum Dr Unit (LOT 66)
- 7804 Alyssum Dr Unit L 66
- 7716 Alyssum Dr
- 7716 Alyssum Dr Unit LOT 72
- 7801 Hepatica Dr
- 7801 Alyssum Dr
- 7713 Hepatica Dr
- 7713 Hepatica Dr Unit L 44
- 7803 Hepatica Dr Unit 1055
- 7803 Hepatica Dr Unit Lot 49