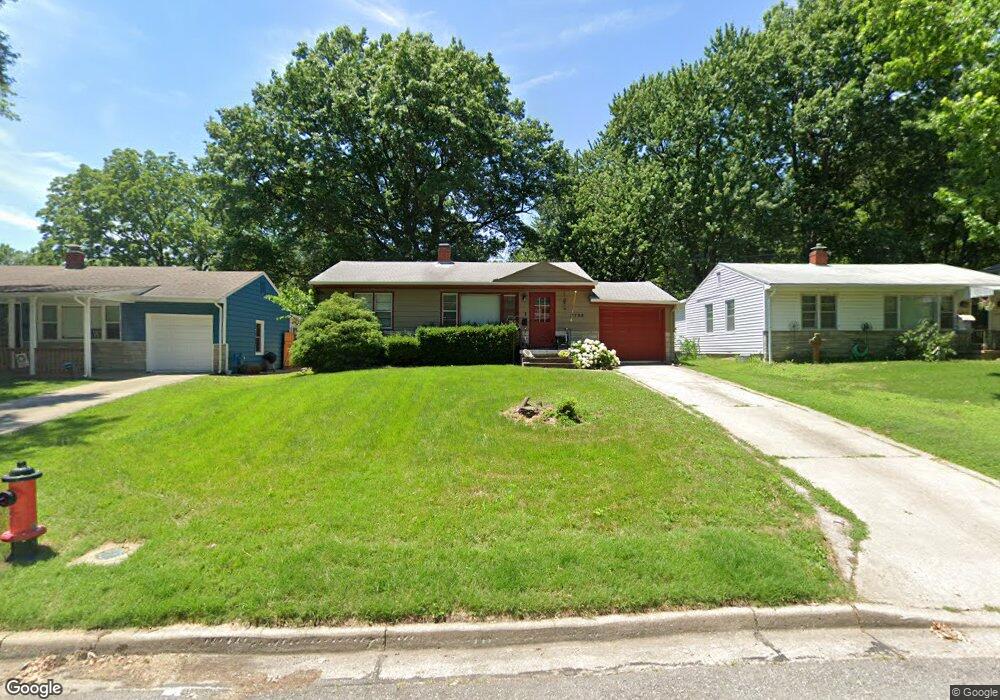
7722 Summit St Kansas City, MO 64114
Waldo NeighborhoodEstimated Value: $239,344 - $264,000
2
Beds
1
Bath
875
Sq Ft
$286/Sq Ft
Est. Value
About This Home
This home is located at 7722 Summit St, Kansas City, MO 64114 and is currently estimated at $250,586, approximately $286 per square foot. 7722 Summit St is a home located in Jackson County with nearby schools including Hale Cook Elementary, Central Middle School, and Southeast High School.
Ownership History
Date
Name
Owned For
Owner Type
Purchase Details
Closed on
May 28, 2021
Sold by
Havey Megan and Estate Of Lakin Elizabeth Powe
Bought by
Powell Lakin E
Current Estimated Value
Purchase Details
Closed on
Sep 21, 2016
Sold by
Alexiou Matthew and Waris Anne
Bought by
Havey Megan Anne and Powell Lakin Elizabeth
Purchase Details
Closed on
Oct 2, 2009
Sold by
Wallace James L and Wallace Jodi
Bought by
Waris Anne
Home Financials for this Owner
Home Financials are based on the most recent Mortgage that was taken out on this home.
Original Mortgage
$119,556
Interest Rate
5.12%
Mortgage Type
FHA
Purchase Details
Closed on
Jul 12, 2004
Sold by
Kleffner Kenneth J and Kleffner Katharine N
Bought by
Wallace James L
Home Financials for this Owner
Home Financials are based on the most recent Mortgage that was taken out on this home.
Original Mortgage
$95,200
Interest Rate
5.25%
Mortgage Type
Purchase Money Mortgage
Create a Home Valuation Report for This Property
The Home Valuation Report is an in-depth analysis detailing your home's value as well as a comparison with similar homes in the area
Home Values in the Area
Average Home Value in this Area
Purchase History
| Date | Buyer | Sale Price | Title Company |
|---|---|---|---|
| Powell Lakin E | -- | None Available | |
| Havey Megan Anne | -- | None Available | |
| Waris Anne | -- | Kansas City Title | |
| Wallace James L | -- | Ctic |
Source: Public Records
Mortgage History
| Date | Status | Borrower | Loan Amount |
|---|---|---|---|
| Previous Owner | Waris Anne | $119,556 | |
| Previous Owner | Wallace James L | $95,200 | |
| Closed | Wallace James L | $11,800 |
Source: Public Records
Tax History Compared to Growth
Tax History
| Year | Tax Paid | Tax Assessment Tax Assessment Total Assessment is a certain percentage of the fair market value that is determined by local assessors to be the total taxable value of land and additions on the property. | Land | Improvement |
|---|---|---|---|---|
| 2025 | $2,424 | $33,920 | $15,973 | $17,947 |
| 2024 | $2,401 | $30,714 | $7,667 | $23,047 |
| 2023 | $2,401 | $30,714 | $7,068 | $23,646 |
| 2022 | $2,110 | $25,650 | $7,572 | $18,078 |
| 2021 | $2,103 | $25,650 | $7,572 | $18,078 |
| 2020 | $1,873 | $22,569 | $7,572 | $14,997 |
| 2019 | $1,835 | $22,569 | $7,572 | $14,997 |
| 2018 | $1,793 | $22,522 | $3,733 | $18,789 |
| 2017 | $1,758 | $22,522 | $3,733 | $18,789 |
| 2016 | $1,758 | $21,958 | $3,535 | $18,423 |
| 2014 | $1,728 | $21,527 | $3,466 | $18,061 |
Source: Public Records
Map
Nearby Homes
- 7826 Summit St
- 514 W 77th St
- 7544 Summit St
- 7602 Pennsylvania Ave
- 1127 W 76th Terrace
- 7515 Jefferson St
- 7514 Pennsylvania Ave
- 826 W 75th St
- 7615 Terrace St
- 7416 Belleview Ave
- 615 W 74th St
- 24 W 78th Terrace
- 208 W 81st St
- 8117 Summit St
- 18 W 79th Terrace
- 8020 Mercier St
- 7603 Main St
- 109 W 80th St
- 7305 Washington St
- 8110 Ward Parkway Plaza
- 7726 Summit St
- 7716 Summit St
- 7728 Summit St
- 7714 Summit St
- 7717 Summit St
- 7715 Summit St
- 7719 Summit St
- 7717R Summit St
- 7713 Summit St
- 7729 Madison Ave
- 7730 Summit St
- 7711 Summit St
- 7725 Summit St
- 7732 Summit St
- 7732 Summit St
- 805 W 77th St
- 7736 Summit St
- 7721 Madison Ave
- 807 W 77th St
- 7725 Madison Ave