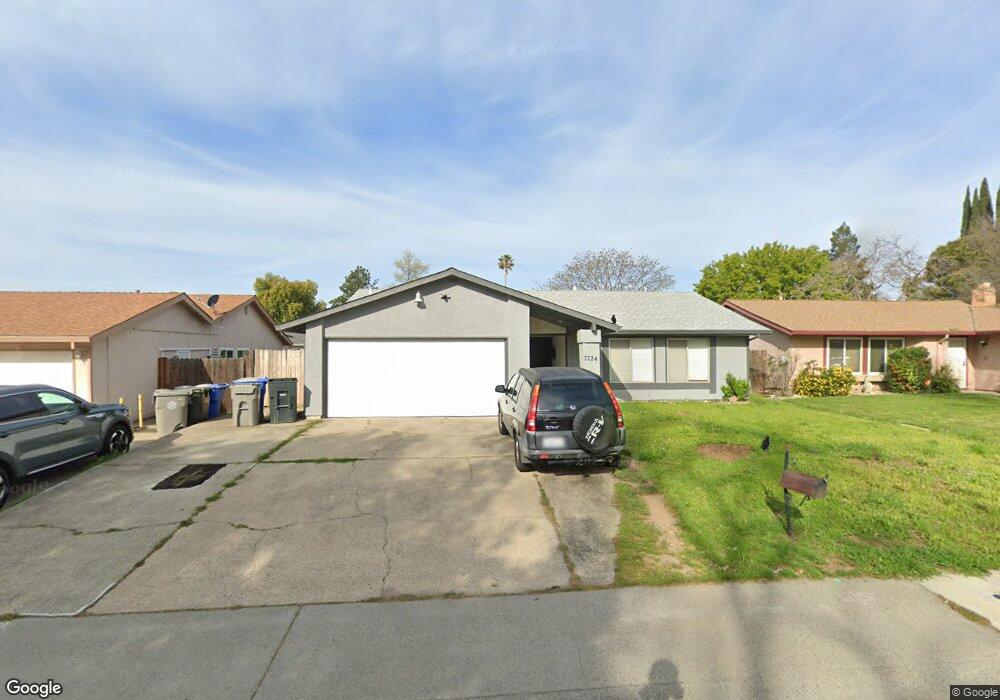
7724 Abaline Way Sacramento, CA 95823
Estimated Value: $93,000 - $442,000
3
Beds
2
Baths
2,023
Sq Ft
$174/Sq Ft
Est. Value
About This Home
This home is located at 7724 Abaline Way, Sacramento, CA 95823 and is currently estimated at $353,009, approximately $174 per square foot. 7724 Abaline Way is a home located in Sacramento County with nearby schools including Charles E. Mack Elementary School, Samuel Jackman Middle School, and Valley High School.
Ownership History
Date
Name
Owned For
Owner Type
Purchase Details
Closed on
Oct 15, 2012
Sold by
Bubakar Moustafa
Bought by
Mohammed Lyfor
Current Estimated Value
Purchase Details
Closed on
Feb 27, 2010
Sold by
Sarly Moustafa
Bought by
Bubakar Moustafa
Purchase Details
Closed on
Aug 14, 2009
Sold by
Bubakar Moustafa and Sarly Moustafa
Bought by
Sarly Mustafa
Purchase Details
Closed on
Sep 10, 2002
Sold by
Bubakar Moustafa and Sarly Moustafa
Bought by
Sarly Moustafa
Purchase Details
Closed on
Dec 17, 2001
Sold by
Bubakar Moustafa
Bought by
Bubakar Moustafa and Sarly Moustafa
Purchase Details
Closed on
Jan 11, 1999
Sold by
Allred Myrna V
Bought by
Bubakar Moustafa
Home Financials for this Owner
Home Financials are based on the most recent Mortgage that was taken out on this home.
Original Mortgage
$50,000
Interest Rate
6.66%
Create a Home Valuation Report for This Property
The Home Valuation Report is an in-depth analysis detailing your home's value as well as a comparison with similar homes in the area
Home Values in the Area
Average Home Value in this Area
Purchase History
| Date | Buyer | Sale Price | Title Company |
|---|---|---|---|
| Mohammed Lyfor | $42,500 | None Available | |
| Bubakar Moustafa | $114,500 | None Available | |
| Sarly Mustafa | -- | None Available | |
| Sarly Moustafa | -- | -- | |
| Bubakar Moustafa | -- | -- | |
| Bubakar Moustafa | $84,000 | North American Title Guarant |
Source: Public Records
Mortgage History
| Date | Status | Borrower | Loan Amount |
|---|---|---|---|
| Previous Owner | Bubakar Moustafa | $50,000 |
Source: Public Records
Tax History Compared to Growth
Tax History
| Year | Tax Paid | Tax Assessment Tax Assessment Total Assessment is a certain percentage of the fair market value that is determined by local assessors to be the total taxable value of land and additions on the property. | Land | Improvement |
|---|---|---|---|---|
| 2025 | $1,247 | $104,660 | $36,938 | $67,722 |
| 2024 | $1,247 | $102,609 | $36,214 | $66,395 |
| 2023 | $1,207 | $100,598 | $35,504 | $65,094 |
| 2022 | $1,198 | $98,626 | $34,808 | $63,818 |
| 2021 | $1,173 | $96,693 | $34,126 | $62,567 |
| 2020 | $1,151 | $95,703 | $33,777 | $61,926 |
| 2019 | $1,130 | $93,827 | $33,115 | $60,712 |
| 2018 | $1,098 | $91,988 | $32,466 | $59,522 |
| 2017 | $1,071 | $90,185 | $31,830 | $58,355 |
| 2016 | $1,062 | $88,417 | $31,206 | $57,211 |
| 2015 | $1,028 | $87,090 | $30,738 | $56,352 |
| 2014 | $1,019 | $85,385 | $30,136 | $55,249 |
Source: Public Records
Map
Nearby Homes
- 7741 Telfer Way
- 5530 Seyferth Way
- 5520 Lerner Way
- 7700 La Mancha Way
- 86 Thatcher Cir
- 7648 Center Pkwy
- 5953 Bamford Dr
- 5837 Ambler St
- 5975 Bamford Dr
- 7706 Whispering Palms Dr
- 5160 Scarborough Way
- 5906 Stacy Ave
- 6119 Bamford Dr
- 7734 Whispering Palms Dr
- 5104 Tangerine Ave
- 7509 Persimmon Ave
- 5385 Bamford Dr
- 6124 Pomegranate Ave
- 6420 S Elder Ct
- 5200 Pomegranate Ave
- 7718 Abaline Way
- 7730 Abaline Way
- 7727 Canova Way
- 7731 Canova Way
- 7723 Canova Way
- 7712 Abaline Way
- 7736 Abaline Way
- 7725 Abaline Way
- 7733 Canova Way
- 7731 Abaline Way
- 7719 Canova Way
- 7719 Abaline Way Unit 2
- 7706 Abaline Way
- 7740 Abaline Way
- 7737 Abaline Way
- 7737 Canova Way
- 7715 Canova Way
- 7713 Abaline Way
- 7743 Abaline Way
- 7700 Abaline Way