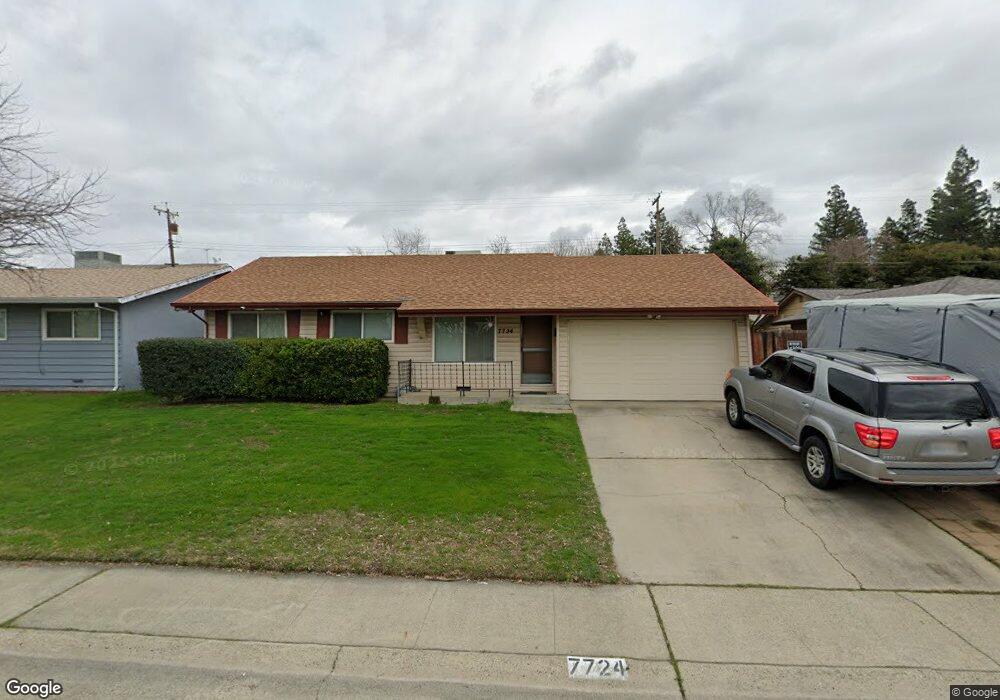
7724 Bierston St Citrus Heights, CA 95621
Estimated Value: $435,000 - $483,000
3
Beds
2
Baths
1,167
Sq Ft
$390/Sq Ft
Est. Value
About This Home
This home is located at 7724 Bierston St, Citrus Heights, CA 95621 and is currently estimated at $454,790, approximately $389 per square foot. 7724 Bierston St is a home located in Sacramento County with nearby schools including Grand Oaks Elementary School, Sylvan Middle School, and Mesa Verde High School.
Ownership History
Date
Name
Owned For
Owner Type
Purchase Details
Closed on
Oct 13, 2005
Sold by
Pitt Glenn and Pitt Kerrie
Bought by
Pitt Glenn and Pitt Kerrie
Current Estimated Value
Home Financials for this Owner
Home Financials are based on the most recent Mortgage that was taken out on this home.
Original Mortgage
$30,000
Outstanding Balance
$208
Interest Rate
5.68%
Mortgage Type
New Conventional
Estimated Equity
$454,582
Purchase Details
Closed on
Jul 17, 2002
Sold by
Loiler Don H and Loiler Lana D
Bought by
Pitt Glenn and Mcmahon Kerrie
Home Financials for this Owner
Home Financials are based on the most recent Mortgage that was taken out on this home.
Original Mortgage
$179,465
Outstanding Balance
$75,485
Interest Rate
6.6%
Mortgage Type
FHA
Estimated Equity
$379,305
Create a Home Valuation Report for This Property
The Home Valuation Report is an in-depth analysis detailing your home's value as well as a comparison with similar homes in the area
Home Values in the Area
Average Home Value in this Area
Purchase History
| Date | Buyer | Sale Price | Title Company |
|---|---|---|---|
| Pitt Glenn | -- | -- | |
| Pitt Glenn | $182,000 | Commonwealth Land Title Co |
Source: Public Records
Mortgage History
| Date | Status | Borrower | Loan Amount |
|---|---|---|---|
| Open | Pitt Glenn | $30,000 | |
| Open | Pitt Glenn | $179,465 | |
| Closed | Pitt Glenn | $10,200 |
Source: Public Records
Tax History Compared to Growth
Tax History
| Year | Tax Paid | Tax Assessment Tax Assessment Total Assessment is a certain percentage of the fair market value that is determined by local assessors to be the total taxable value of land and additions on the property. | Land | Improvement |
|---|---|---|---|---|
| 2025 | $3,043 | $263,570 | $50,680 | $212,890 |
| 2024 | $3,043 | $258,403 | $49,687 | $208,716 |
| 2023 | $2,964 | $253,337 | $48,713 | $204,624 |
| 2022 | $2,948 | $248,370 | $47,758 | $200,612 |
| 2021 | $2,897 | $243,501 | $46,822 | $196,679 |
| 2020 | $2,843 | $241,005 | $46,342 | $194,663 |
| 2019 | $2,784 | $236,281 | $45,434 | $190,847 |
| 2018 | $2,751 | $231,649 | $44,544 | $187,105 |
| 2017 | $2,722 | $227,108 | $43,671 | $183,437 |
| 2016 | $2,542 | $222,656 | $42,815 | $179,841 |
| 2015 | $2,498 | $219,312 | $42,172 | $177,140 |
| 2014 | $2,320 | $204,317 | $39,289 | $165,028 |
Source: Public Records
Map
Nearby Homes
- 7716 Las Lilas Ct
- 6112 Ledgewood Way
- 7600 Golden Eye Ln Unit 43
- 7449 Mar Vista Way
- 6020 Cackler Ln
- 6008 Cackler Ln Unit 88
- 7516 Scaup Ln
- 7439 Saybrook Dr
- 6007 Birchglade Way
- 5947 Woodglade Ave
- 7533 Pintail Cir
- 6501 Navion Dr
- 5922 Cackler Ln Unit 83
- 6721 Navion Dr
- 6301 Autumn Oak Ct
- 5956 Birchglade Way
- 7956 Brockwood Way
- 7633 Wood Duck Ln Unit 67
- 6508 Skylane Dr
- 6600 Branchwater Way
- 7730 Bierston St
- 7718 Bierston St
- 7721 Pompei Ct
- 7723 Pompei Ct
- 7736 Quincewood Cir
- 7712 Bierston St
- 7717 Pompei Ct
- 6236 Rumford Ave
- 7725 Pompei Ct
- 7719 Bierston St
- 7706 Bierston St
- 7742 Quincewood Cir
- 7735 Quincewood Cir
- 7713 Bierston St
- 7729 Pompei Ct
- 7713 Pompei Ct
- 7741 Quincewood Cir
- 6224 Rumford Ave
- 7707 Bierston St
- 7700 Bierston St