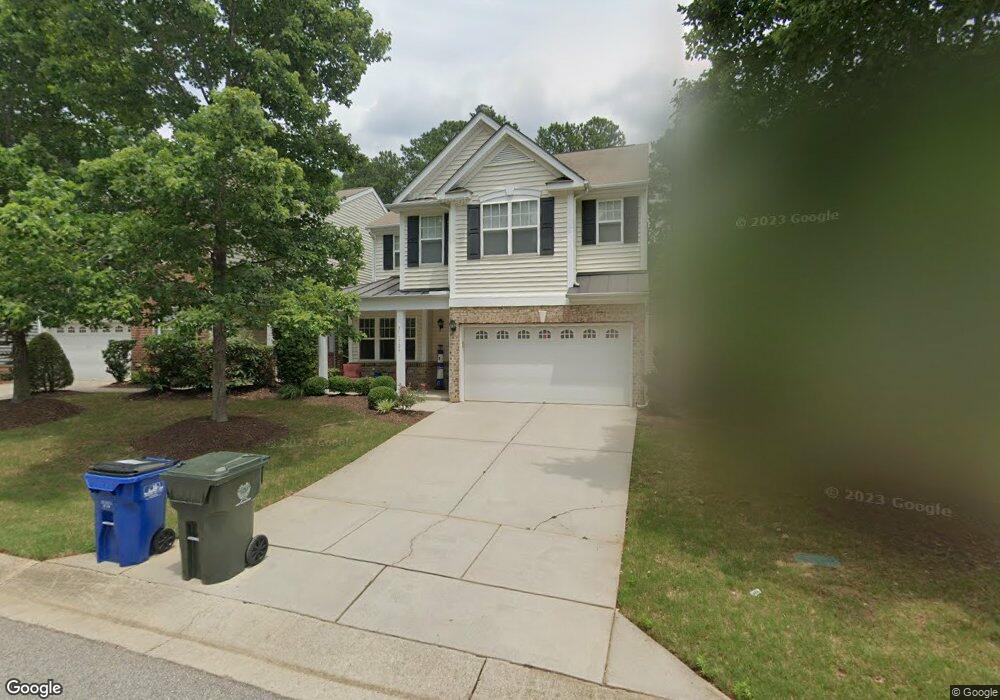
7724 Cape Charles Dr Raleigh, NC 27617
Umstead NeighborhoodEstimated Value: $422,682 - $454,000
3
Beds
3
Baths
1,784
Sq Ft
$247/Sq Ft
Est. Value
About This Home
This home is located at 7724 Cape Charles Dr, Raleigh, NC 27617 and is currently estimated at $440,921, approximately $247 per square foot. 7724 Cape Charles Dr is a home located in Wake County with nearby schools including Sycamore Creek Elementary School, Pine Hollow Middle School, and Leesville Road High School.
Ownership History
Date
Name
Owned For
Owner Type
Purchase Details
Closed on
Jul 18, 2018
Sold by
Carpenter Carol
Bought by
Finley George Erin
Current Estimated Value
Home Financials for this Owner
Home Financials are based on the most recent Mortgage that was taken out on this home.
Original Mortgage
$186,000
Outstanding Balance
$161,197
Interest Rate
4.5%
Mortgage Type
New Conventional
Estimated Equity
$279,724
Purchase Details
Closed on
May 20, 2015
Sold by
Hillmann Robert D
Bought by
Carpenter Carol
Home Financials for this Owner
Home Financials are based on the most recent Mortgage that was taken out on this home.
Original Mortgage
$219,600
Interest Rate
3.77%
Mortgage Type
New Conventional
Purchase Details
Closed on
Feb 16, 2007
Sold by
Centex Homes
Bought by
Hillmann Robert D
Home Financials for this Owner
Home Financials are based on the most recent Mortgage that was taken out on this home.
Original Mortgage
$180,000
Interest Rate
6.08%
Mortgage Type
Unknown
Create a Home Valuation Report for This Property
The Home Valuation Report is an in-depth analysis detailing your home's value as well as a comparison with similar homes in the area
Home Values in the Area
Average Home Value in this Area
Purchase History
| Date | Buyer | Sale Price | Title Company |
|---|---|---|---|
| Finley George Erin | $286,000 | None Available | |
| Carpenter Carol | $248,000 | None Available | |
| Hillmann Robert D | $234,500 | None Available |
Source: Public Records
Mortgage History
| Date | Status | Borrower | Loan Amount |
|---|---|---|---|
| Open | Finley George Erin | $186,000 | |
| Previous Owner | Carpenter Carol | $219,600 | |
| Previous Owner | Hillmann Robert D | $180,000 |
Source: Public Records
Tax History Compared to Growth
Tax History
| Year | Tax Paid | Tax Assessment Tax Assessment Total Assessment is a certain percentage of the fair market value that is determined by local assessors to be the total taxable value of land and additions on the property. | Land | Improvement |
|---|---|---|---|---|
| 2025 | $3,469 | $395,527 | $105,000 | $290,527 |
| 2024 | $3,455 | $395,527 | $105,000 | $290,527 |
| 2023 | $3,064 | $279,277 | $56,000 | $223,277 |
| 2022 | $2,848 | $279,277 | $56,000 | $223,277 |
| 2021 | $2,737 | $279,277 | $56,000 | $223,277 |
| 2020 | $2,688 | $279,277 | $56,000 | $223,277 |
| 2019 | $2,777 | $237,894 | $60,000 | $177,894 |
| 2018 | $0 | $237,894 | $60,000 | $177,894 |
| 2017 | $2,495 | $237,894 | $60,000 | $177,894 |
| 2016 | $2,444 | $237,894 | $60,000 | $177,894 |
| 2015 | $2,631 | $252,115 | $56,000 | $196,115 |
| 2014 | -- | $252,115 | $56,000 | $196,115 |
Source: Public Records
Map
Nearby Homes
- 6123 Blakeman Ln
- 7846 Cape Charles Dr
- 10901 Bayflower Way
- 10907 Bayflower Way
- 10900 Bayflower Way
- 10917 Bayflower Way
- 10906 Bayflower Way
- 10916 Bayflower Way
- 5950 Dunzo Dr
- 6108 Dunzo Dr
- 5960 Dunzo Dr
- 5952 Dunzo Dr
- 5956 Dunzo Dr
- 5900 Dunzo Dr
- 5904 Dunzo Dr
- 5902 Dunzo Dr
- 6040 Dunzo Dr
- 5906 Dunzo Dr
- 5954 Dunzo Dr
- 9305 Dominion Blvd
- 7722 Cape Charles Dr
- 7726 Cape Charles Dr
- 7720 Cape Charles Dr
- 7730 Cape Charles Dr
- 7718 Cape Charles Dr
- 7616 Cagle Dr
- 7716 Cape Charles Dr
- 7804 Cape Charles Dr
- 7717 Cape Charles Dr
- 7614 Cagle Dr
- 7715 Cape Charles Dr
- 7714 Cape Charles Dr
- 7806 Cape Charles Dr
- 7612 Cagle Dr
- 7805 Cape Charles Dr
- 7713 Cape Charles Dr
- 7808 Cape Charles Dr
- 7610 Cagle Dr
- 7712 Cape Charles Dr
- 6157 Blakeman Ln