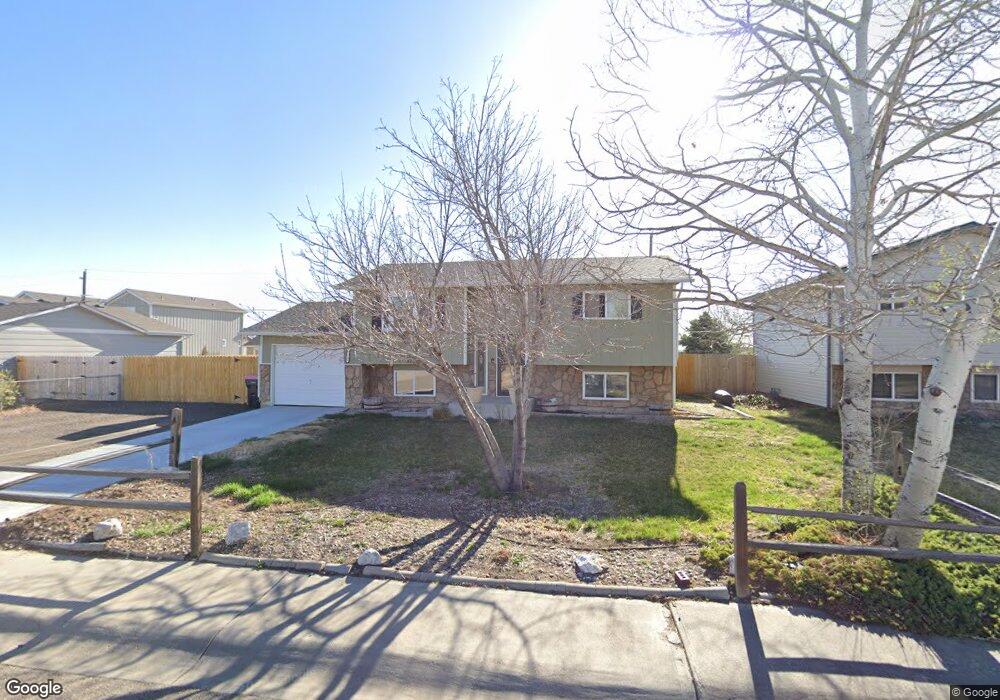
7726 4th St Wellington, CO 80549
Estimated Value: $355,447 - $394,000
4
Beds
2
Baths
1,570
Sq Ft
$244/Sq Ft
Est. Value
About This Home
This home is located at 7726 4th St, Wellington, CO 80549 and is currently estimated at $382,362, approximately $243 per square foot. 7726 4th St is a home located in Larimer County with nearby schools including Rice Elementary School and Wellington Middle School.
Ownership History
Date
Name
Owned For
Owner Type
Purchase Details
Closed on
Jul 17, 2007
Sold by
Aurora Loan Services Llc
Bought by
Mcdaniel Nancy
Current Estimated Value
Home Financials for this Owner
Home Financials are based on the most recent Mortgage that was taken out on this home.
Original Mortgage
$132,070
Outstanding Balance
$83,150
Interest Rate
6.64%
Mortgage Type
Purchase Money Mortgage
Estimated Equity
$299,212
Purchase Details
Closed on
Mar 27, 2007
Sold by
Sanvig Steven
Bought by
Aurora Loan Services Llc
Purchase Details
Closed on
Mar 25, 2002
Sold by
Atkinson Melanie Rae
Bought by
Sanvig Steven
Home Financials for this Owner
Home Financials are based on the most recent Mortgage that was taken out on this home.
Original Mortgage
$152,605
Interest Rate
6.83%
Mortgage Type
FHA
Purchase Details
Closed on
May 1, 1995
Sold by
Atkinson Melanie Rae
Bought by
Atkinson Melanie Rae
Purchase Details
Closed on
Apr 1, 1995
Sold by
Haerter Melanie
Bought by
Atkinson Melanie
Create a Home Valuation Report for This Property
The Home Valuation Report is an in-depth analysis detailing your home's value as well as a comparison with similar homes in the area
Home Values in the Area
Average Home Value in this Area
Purchase History
| Date | Buyer | Sale Price | Title Company |
|---|---|---|---|
| Mcdaniel Nancy | $140,500 | Chicago Title Co | |
| Aurora Loan Services Llc | -- | None Available | |
| Sanvig Steven | $155,000 | -- | |
| Atkinson Melanie Rae | -- | -- | |
| Atkinson Melanie | -- | -- |
Source: Public Records
Mortgage History
| Date | Status | Borrower | Loan Amount |
|---|---|---|---|
| Open | Mcdaniel Nancy | $132,070 | |
| Previous Owner | Sanvig Steven | $152,605 |
Source: Public Records
Tax History Compared to Growth
Tax History
| Year | Tax Paid | Tax Assessment Tax Assessment Total Assessment is a certain percentage of the fair market value that is determined by local assessors to be the total taxable value of land and additions on the property. | Land | Improvement |
|---|---|---|---|---|
| 2025 | $2,339 | $24,864 | $1,541 | $23,323 |
| 2024 | $2,244 | $24,864 | $1,541 | $23,323 |
| 2022 | $1,985 | $18,091 | $1,599 | $16,492 |
| 2021 | $2,012 | $18,612 | $1,645 | $16,967 |
| 2020 | $2,119 | $19,456 | $1,645 | $17,811 |
| 2019 | $2,128 | $19,456 | $1,645 | $17,811 |
| 2018 | $1,553 | $14,551 | $1,656 | $12,895 |
| 2017 | $1,550 | $14,551 | $1,656 | $12,895 |
| 2016 | $1,272 | $12,649 | $1,831 | $10,818 |
| 2015 | $1,251 | $12,650 | $1,830 | $10,820 |
| 2014 | $1,024 | $10,240 | $1,830 | $8,410 |
Source: Public Records
Map
Nearby Homes
- 7775 5th St Unit 2
- 3810 Jackson Ct
- 3749 Boxelder Ct
- 3814 Hamilton Ave
- 3904 Sweetgum St
- 3740 Tyler Ave
- 3833 Lincoln Ave
- 3804 Buckthorn St
- 7979 5th St
- 7935 6th St
- 3787 Buckthorn St
- 3822 Roosevelt Ave
- 3835 River Birch St
- 8111 3rd St
- 7437 Home Stretch Dr
- 3750 River Birch St
- 7578 Little Fox Ln
- 3961 Eucalyptus St
- 0 6th St Unit 1039869
- 4134 Cypress Ridge Ln