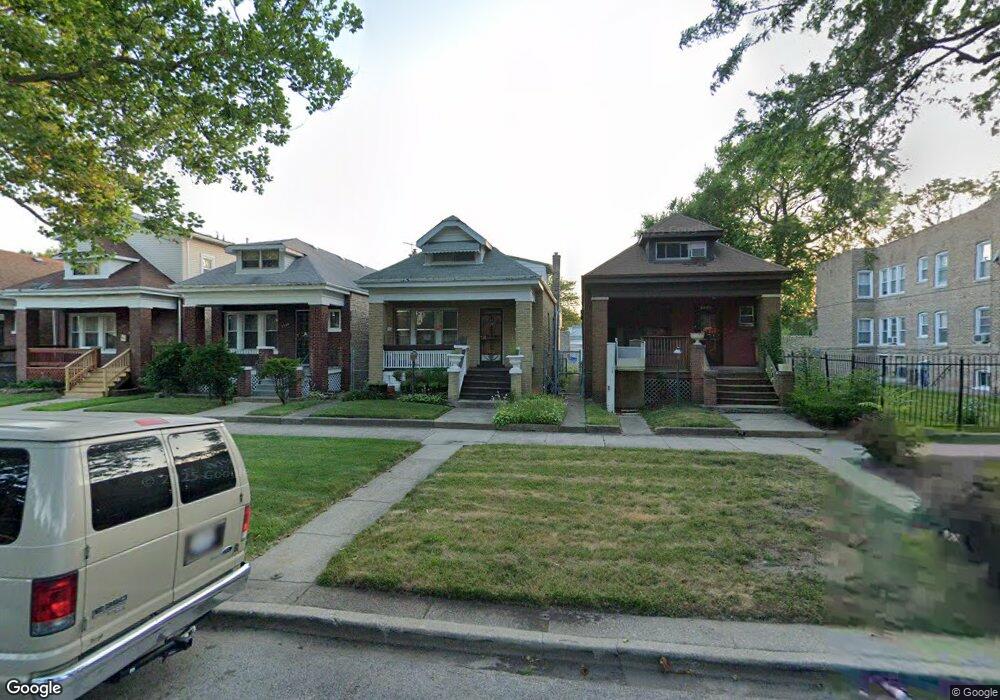
7726 S Calumet Ave Chicago, IL 60619
Park Manor NeighborhoodEstimated Value: $190,000 - $274,000
3
Beds
1
Bath
924
Sq Ft
$232/Sq Ft
Est. Value
About This Home
This home is located at 7726 S Calumet Ave, Chicago, IL 60619 and is currently estimated at $214,607, approximately $232 per square foot. 7726 S Calumet Ave is a home located in Cook County with nearby schools including Ruggles Elementary School and Rescue Missionary Christian School.
Ownership History
Date
Name
Owned For
Owner Type
Purchase Details
Closed on
Sep 13, 2018
Sold by
Chicago Title Land Trust Comapny
Bought by
Riley Frank and The Frank Riley Jr Liiving Trust
Current Estimated Value
Purchase Details
Closed on
Mar 21, 2008
Sold by
Riley Frank
Bought by
Frank Riley Jr Living Trust
Purchase Details
Closed on
Jan 26, 1993
Sold by
Riley Erma
Bought by
Riley Frank
Create a Home Valuation Report for This Property
The Home Valuation Report is an in-depth analysis detailing your home's value as well as a comparison with similar homes in the area
Home Values in the Area
Average Home Value in this Area
Purchase History
| Date | Buyer | Sale Price | Title Company |
|---|---|---|---|
| Riley Frank | -- | None Available | |
| Frank Riley Jr Living Trust | -- | None Available | |
| Riley Frank | -- | -- |
Source: Public Records
Tax History Compared to Growth
Tax History
| Year | Tax Paid | Tax Assessment Tax Assessment Total Assessment is a certain percentage of the fair market value that is determined by local assessors to be the total taxable value of land and additions on the property. | Land | Improvement |
|---|---|---|---|---|
| 2024 | $3,165 | $11,800 | $3,260 | $8,540 |
| 2023 | $3,085 | $15,000 | $4,347 | $10,653 |
| 2022 | $3,085 | $15,000 | $4,347 | $10,653 |
| 2021 | $3,016 | $15,000 | $4,347 | $10,653 |
| 2020 | $2,223 | $9,980 | $3,477 | $6,503 |
| 2019 | $2,203 | $10,967 | $3,477 | $7,490 |
| 2018 | $2,166 | $10,967 | $3,477 | $7,490 |
| 2017 | $2,497 | $11,600 | $3,042 | $8,558 |
| 2016 | $2,323 | $11,600 | $3,042 | $8,558 |
| 2015 | $445 | $11,600 | $3,042 | $8,558 |
| 2014 | $441 | $10,479 | $2,608 | $7,871 |
| 2013 | $443 | $10,479 | $2,608 | $7,871 |
Source: Public Records
Map
Nearby Homes
- 7720 S Prairie Ave
- 7627 S Prairie Ave
- 7616 S Calumet Ave
- 7741 S Indiana Ave
- 7736 S Indiana Ave
- 7808 S Vernon Ave
- 7635 S Michigan Ave
- 7918 S Calumet Ave
- 7832 S Eberhart Ave
- 7801 S Eberhart Ave
- 7817 S Eberhart Ave
- 7535 S Vernon Ave
- 7744 S Rhodes Ave
- 7619 S Wabash Ave
- 7811 S Wabash Ave
- 7708 S Wabash Ave
- 7533 S Eberhart Ave
- 7658 S Wabash Ave
- 7646 S Wabash Ave
- 7817 S Rhodes Ave
- 7724 S Calumet Ave
- 7728 S Calumet Ave
- 7732 S Calumet Ave
- 7734 S Calumet Ave
- 7716 S Calumet Ave
- 7736 S Calumet Ave
- 7712 S Calumet Ave
- 7740 S Calumet Ave
- 7710 S Calumet Ave
- 7742 S Calumet Ave
- 7729 S Prairie Ave
- 7725 S Prairie Ave
- 7731 S Prairie Ave
- 7723 S Prairie Ave
- 7744 S Calumet Ave
- 7706 S Calumet Ave
- 7735 S Prairie Ave
- 7719 S Prairie Ave
- 7739 S Prairie Ave
- 7715 S Prairie Ave