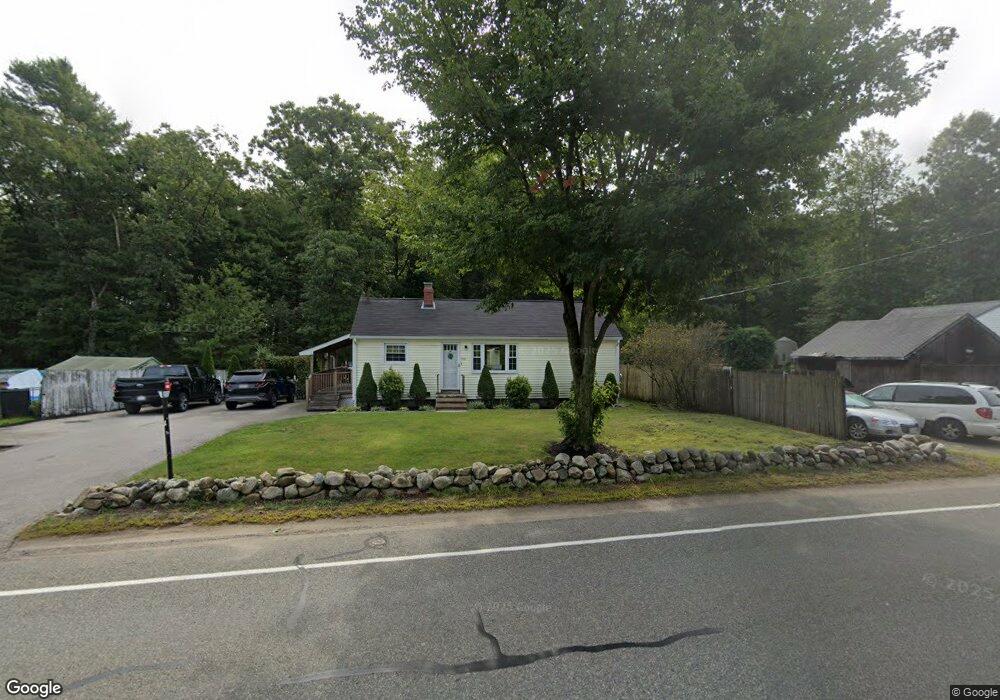
773 Hingham St Rockland, MA 02370
Estimated Value: $449,000 - $472,000
2
Beds
1
Bath
828
Sq Ft
$553/Sq Ft
Est. Value
About This Home
This home is located at 773 Hingham St, Rockland, MA 02370 and is currently estimated at $457,492, approximately $552 per square foot. 773 Hingham St is a home located in Plymouth County with nearby schools including Rockland Senior High School, South Shore Charter Public School, and The Accord School.
Ownership History
Date
Name
Owned For
Owner Type
Purchase Details
Closed on
Oct 4, 2004
Sold by
Pedersen William and Pedersen Lisa S
Bought by
Murray Mary E and Kearns James
Current Estimated Value
Purchase Details
Closed on
Nov 17, 2000
Sold by
Segalla Michael and Segalla Judy A
Bought by
Pedersen William and Pedersen Lisa S
Home Financials for this Owner
Home Financials are based on the most recent Mortgage that was taken out on this home.
Original Mortgage
$163,850
Interest Rate
7.78%
Mortgage Type
Purchase Money Mortgage
Create a Home Valuation Report for This Property
The Home Valuation Report is an in-depth analysis detailing your home's value as well as a comparison with similar homes in the area
Home Values in the Area
Average Home Value in this Area
Purchase History
| Date | Buyer | Sale Price | Title Company |
|---|---|---|---|
| Murray Mary E | $270,000 | -- | |
| Pedersen William | $172,500 | -- |
Source: Public Records
Mortgage History
| Date | Status | Borrower | Loan Amount |
|---|---|---|---|
| Previous Owner | Pedersen William | $163,850 | |
| Previous Owner | Pedersen William | $100,000 | |
| Previous Owner | Pedersen William | $120,183 |
Source: Public Records
Tax History
| Year | Tax Paid | Tax Assessment Tax Assessment Total Assessment is a certain percentage of the fair market value that is determined by local assessors to be the total taxable value of land and additions on the property. | Land | Improvement |
|---|---|---|---|---|
| 2025 | $5,229 | $382,500 | $213,200 | $169,300 |
| 2024 | $5,076 | $361,000 | $201,100 | $159,900 |
| 2023 | $4,893 | $321,500 | $174,700 | $146,800 |
| 2022 | $4,687 | $279,800 | $151,900 | $127,900 |
| 2021 | $4,384 | $253,700 | $138,100 | $115,600 |
| 2020 | $4,232 | $241,800 | $131,600 | $110,200 |
| 2019 | $4,129 | $230,400 | $125,300 | $105,100 |
| 2018 | $4,252 | $209,700 | $125,300 | $84,400 |
| 2017 | $3,759 | $203,400 | $125,300 | $78,100 |
| 2016 | $3,618 | $195,700 | $120,500 | $75,200 |
| 2015 | $3,463 | $182,000 | $112,600 | $69,400 |
| 2014 | $3,274 | $178,500 | $110,400 | $68,100 |
Source: Public Records
Map
Nearby Homes
- 55 Turner Rd
- 18 Colby St
- 8 Blueberry Ct
- 17 Pine Haven Cir
- 5 Blueberry Ct
- 7 Boxberry Ln Unit 7
- 14 Pleasant View Park
- 206-208 Hinghm St
- 21 Liberty Ct
- 18 Winterberry Ln
- 55 Oregon Ave
- 737-739 Union St
- 100 Whiting St
- 35-37 Salem St
- 40 Summit St
- 48 Bigelow Ave
- 436 E Water St
- 98 Myrtle St
- 73 Shingle Mill Ln
- 14 Dyer St Unit 14
- 791 Hingham St
- 771 Hingham St
- 767 Hingham St
- 805 Hingham St
- 770 Hingham St
- 749 Hingham St
- 624 Forest St
- 739 Hingham St
- 731 Hingham St
- 825 Hingham St
- 831 Hingham St
- 835 Hingham St
- 616 Forest St
- 729 Hingham St
- 719 Hingham St
- 695 Hingham St
- 586 Forest St Unit 588
- 586 Forest St Unit 1
- 97 Weymouth St
- 693 Hingham St
Your Personal Tour Guide
Ask me questions while you tour the home.