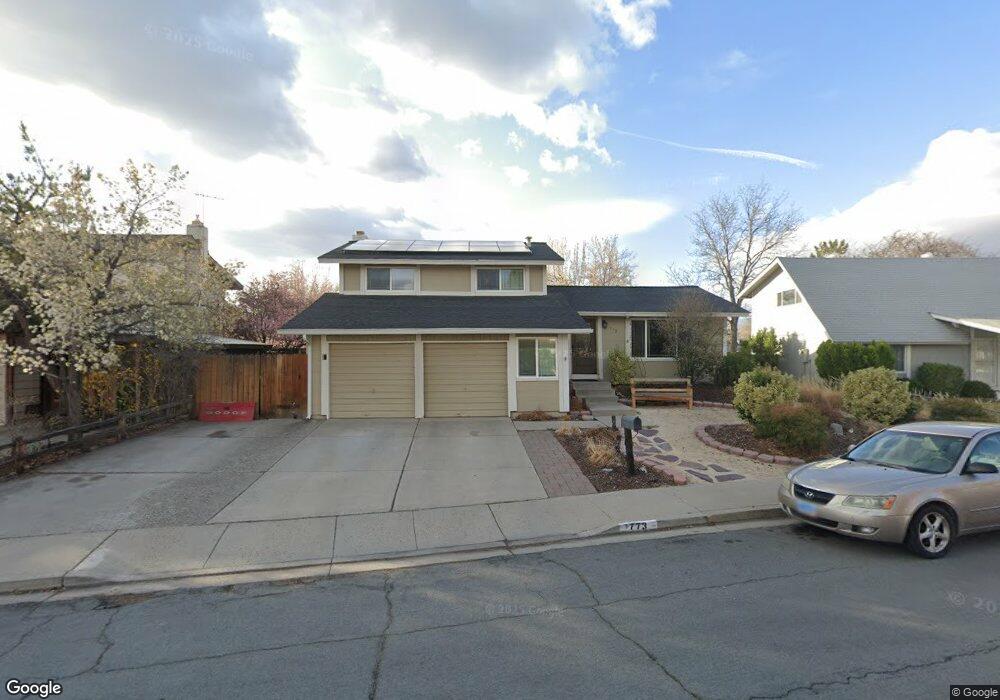
773 O Callaghan Dr Sparks, NV 89434
O'Callaghan NeighborhoodEstimated Value: $505,000 - $576,000
4
Beds
3
Baths
2,064
Sq Ft
$259/Sq Ft
Est. Value
About This Home
This home is located at 773 O Callaghan Dr, Sparks, NV 89434 and is currently estimated at $534,742, approximately $259 per square foot. 773 O Callaghan Dr is a home located in Washoe County with nearby schools including Katherine Dunn Elementary School, George L Dilworth Middle School, and Edward C Reed High School.
Ownership History
Date
Name
Owned For
Owner Type
Purchase Details
Closed on
Aug 24, 2016
Sold by
Mackay Ramsey A and Mackay Carolyn
Bought by
Mackay Ramsey A and Mackay Carolyn
Current Estimated Value
Purchase Details
Closed on
Oct 25, 2004
Sold by
Mackay Donald M and Mackay Nellie A
Bought by
Mackay Ramsey A and Mackay Carolyn
Home Financials for this Owner
Home Financials are based on the most recent Mortgage that was taken out on this home.
Original Mortgage
$120,800
Interest Rate
5.74%
Mortgage Type
New Conventional
Purchase Details
Closed on
May 28, 1996
Sold by
Mcveigh Michael J and Mcveigh Sally G
Bought by
Mackay Ramsey A and Mackay Carolyn
Home Financials for this Owner
Home Financials are based on the most recent Mortgage that was taken out on this home.
Original Mortgage
$140,760
Interest Rate
8.07%
Mortgage Type
FHA
Create a Home Valuation Report for This Property
The Home Valuation Report is an in-depth analysis detailing your home's value as well as a comparison with similar homes in the area
Home Values in the Area
Average Home Value in this Area
Purchase History
| Date | Buyer | Sale Price | Title Company |
|---|---|---|---|
| Mackay Ramsey A | -- | None Available | |
| Mackay Ramsey A | -- | Stewart Title Of Northern Nv | |
| Mackay Ramsey A | $158,000 | Stewart Title |
Source: Public Records
Mortgage History
| Date | Status | Borrower | Loan Amount |
|---|---|---|---|
| Closed | Mackay Ramsey A | $120,800 | |
| Closed | Mackay Ramsey A | $140,760 |
Source: Public Records
Tax History Compared to Growth
Tax History
| Year | Tax Paid | Tax Assessment Tax Assessment Total Assessment is a certain percentage of the fair market value that is determined by local assessors to be the total taxable value of land and additions on the property. | Land | Improvement |
|---|---|---|---|---|
| 2025 | $2,064 | $82,762 | $41,003 | $41,760 |
| 2024 | $2,064 | $78,372 | $35,882 | $42,490 |
| 2023 | $2,005 | $74,283 | $33,296 | $40,988 |
| 2022 | $1,947 | $63,665 | $28,849 | $34,816 |
| 2021 | $1,893 | $57,488 | $22,234 | $35,254 |
| 2020 | $1,834 | $57,471 | $21,536 | $35,935 |
| 2019 | $1,781 | $55,117 | $19,808 | $35,309 |
| 2018 | $1,705 | $48,431 | $14,075 | $34,356 |
| 2017 | $1,656 | $48,374 | $13,451 | $34,923 |
| 2016 | $1,612 | $48,947 | $12,973 | $35,974 |
| 2015 | $1,211 | $46,640 | $10,180 | $36,460 |
| 2014 | $1,545 | $44,771 | $8,857 | $35,914 |
| 2013 | -- | $41,185 | $6,358 | $34,827 |
Source: Public Records
Map
Nearby Homes
- 949 Crestwood Dr Unit 3
- 848 Parkside Dr Unit 1
- 801 Woodglen Dr Unit 2
- 857 Cherry Tree Dr Unit 3
- 385 Gleeson Way
- 370 O'Brien Way
- 684 Oakwood Dr Unit 3
- 907 Camino Real Dr
- 644 Oakwood Dr Unit 2
- 1897 Bonita Vista Dr
- 1973 Rio Tinto Dr
- 1218 Junction Dr
- 611 Oakwood Dr Unit 1
- 601 Oakwood Dr Unit 4
- 604 Oakwood Dr Unit 1
- 360 E Lincoln Way
- 675 Parlanti Ln Unit 52
- 675 Parlanti Ln Unit 124
- 675 Parlanti Ln Unit 42
- 675 Parlanti Ln
- 753 O Callaghan Dr
- 1185 Howard Dr
- 793 O Callaghan Dr
- 986 Ridgewood Dr
- 986 Ridgewood Dr
- 986 Ridgewood Dr
- 986 Ridgewood Dr
- 986 Ridgewood Dr Unit 1
- 986 Ridgewood Dr Unit 2
- 733 O Callaghan Dr
- 968 Crestwood Dr Unit 2
- 968 Crestwood Dr
- 968 Crestwood Dr
- 968 Crestwood Dr Unit 1
- 968 Crestwood Dr
- 968 Crestwood Dr Unit 4
- 968 Crestwood Dr Unit 3
- 778 O Callaghan Dr
- 778 O'Callaghan Dr
- 957 Ridgewood Dr