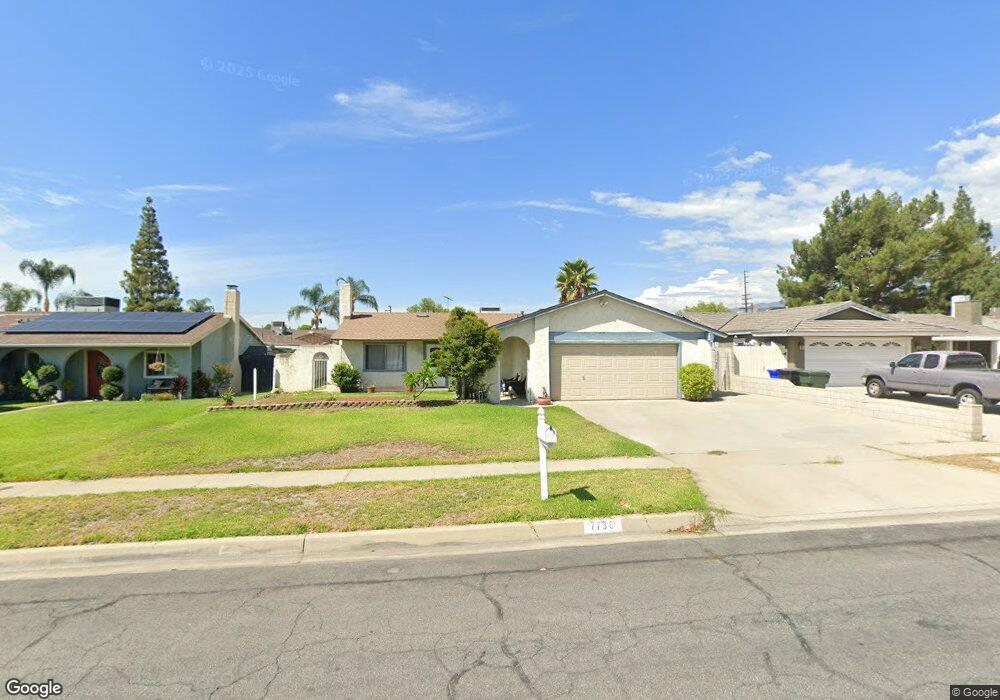
7730 Lockhaven Ct Rancho Cucamonga, CA 91730
Estimated Value: $670,883 - $756,000
4
Beds
2
Baths
1,152
Sq Ft
$613/Sq Ft
Est. Value
About This Home
This home is located at 7730 Lockhaven Ct, Rancho Cucamonga, CA 91730 and is currently estimated at $706,221, approximately $613 per square foot. 7730 Lockhaven Ct is a home located in San Bernardino County with nearby schools including Dona Merced Elementary, Ruth Musser Middle, and Rancho Cucamonga High School.
Ownership History
Date
Name
Owned For
Owner Type
Purchase Details
Closed on
Nov 19, 2007
Sold by
Robles Arturo and Robles Hong Tuyet
Bought by
Henderson Jonathan
Current Estimated Value
Home Financials for this Owner
Home Financials are based on the most recent Mortgage that was taken out on this home.
Original Mortgage
$302,400
Outstanding Balance
$190,143
Interest Rate
6.26%
Mortgage Type
Purchase Money Mortgage
Estimated Equity
$516,078
Purchase Details
Closed on
Aug 30, 2000
Sold by
Robles Arturo and Velasquez Mark
Bought by
Robles Arturo and Robles Hong Tuyet
Home Financials for this Owner
Home Financials are based on the most recent Mortgage that was taken out on this home.
Original Mortgage
$149,875
Interest Rate
8.13%
Mortgage Type
Stand Alone First
Purchase Details
Closed on
Feb 5, 1996
Sold by
Leu Chen Chun and Leu Jennifer
Bought by
Robles Arturo and Robles Hong Tuyet
Home Financials for this Owner
Home Financials are based on the most recent Mortgage that was taken out on this home.
Original Mortgage
$119,019
Interest Rate
7.84%
Mortgage Type
FHA
Create a Home Valuation Report for This Property
The Home Valuation Report is an in-depth analysis detailing your home's value as well as a comparison with similar homes in the area
Purchase History
| Date | Buyer | Sale Price | Title Company |
|---|---|---|---|
| Henderson Jonathan | $378,000 | Ticor Title Company | |
| Robles Arturo | -- | Lawyers Title Company | |
| Robles Arturo | $120,000 | Chicago Title Co |
Source: Public Records
Mortgage History
| Date | Status | Borrower | Loan Amount |
|---|---|---|---|
| Open | Henderson Jonathan | $302,400 | |
| Previous Owner | Robles Arturo | $149,875 | |
| Previous Owner | Robles Arturo | $119,019 |
Source: Public Records
Tax History
| Year | Tax Paid | Tax Assessment Tax Assessment Total Assessment is a certain percentage of the fair market value that is determined by local assessors to be the total taxable value of land and additions on the property. | Land | Improvement |
|---|---|---|---|---|
| 2025 | $5,460 | $496,512 | $124,128 | $372,384 |
| 2024 | $5,314 | $486,776 | $121,694 | $365,082 |
| 2023 | $5,197 | $477,232 | $119,308 | $357,924 |
| 2022 | $5,113 | $467,875 | $116,969 | $350,906 |
| 2021 | $5,111 | $458,700 | $114,675 | $344,025 |
| 2020 | $4,671 | $427,300 | $148,900 | $278,400 |
| 2019 | $4,602 | $414,900 | $144,600 | $270,300 |
| 2018 | $4,562 | $414,900 | $144,600 | $270,300 |
| 2017 | $4,247 | $385,900 | $134,500 | $251,400 |
| 2016 | $4,075 | $367,500 | $128,100 | $239,400 |
| 2015 | $3,896 | $350,000 | $122,000 | $228,000 |
| 2014 | $3,470 | $315,000 | $110,000 | $205,000 |
Source: Public Records
Map
Nearby Homes
- 10155 Norwick St
- 10375 Church St
- 10375 Church St Unit 124
- 9967 Yew Ct
- 7598 Dartmouth Ave
- 7595 Teak Way
- 7552 Paramount Ct
- 7930 Perlite Ave
- 9809 Louise Way
- 9812 Casiano Ct
- 10026 10026 Foothill Blvd
- 7715 Abbot Ct
- 7774 Haywood Place
- 7864 Portola Rd
- 10430 Palo Alto St
- 10164 Hampshire St
- 10438 Palo Alto St
- 10532 Wilding Dr
- 9735 El Paseo Dr
- 10554 Cannon Dr
- 7740 Lockhaven Ct
- 7720 Lockhaven Ct
- 7731 Matterhorn Ct
- 7721 Matterhorn Ct
- 7741 Matterhorn Ct
- 7750 Lockhaven Ct
- 7710 Lockhaven Ct
- 7731 Lockhaven Ct
- 7751 Matterhorn Ct
- 7711 Matterhorn Ct
- 7741 Lockhaven Ct
- 7721 Lockhaven Ct
- 7760 Lockhaven Ct
- 7751 Lockhaven Ct
- 7711 Lockhaven Ct
- 7761 Matterhorn Ct
- 7761 Lockhaven Ct
- 7770 Lockhaven Ct
- 7730 Kinlock Ave
- 7730 Matterhorn Ct
Your Personal Tour Guide
Ask me questions while you tour the home.