
7731 E Skelly Dr Tulsa, OK 74129
Johansen Acres NeighborhoodEstimated payment $1,275/month
Highlights
- Deck
- No HOA
- Shed
- Corner Lot
- Porch
- Tile Flooring
About This Home
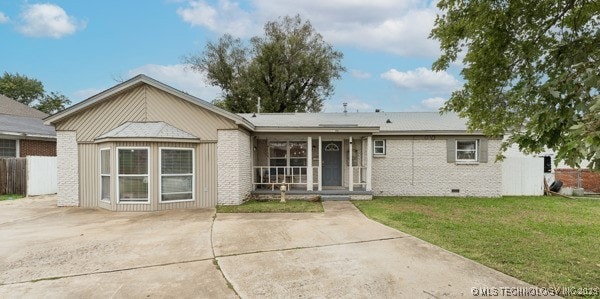
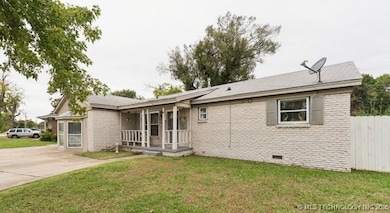
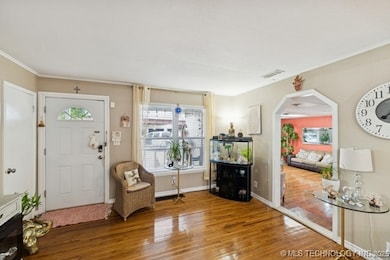
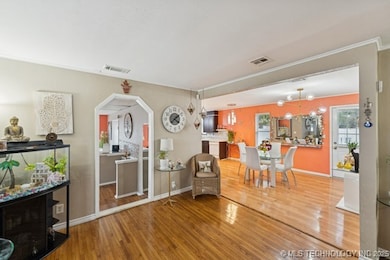
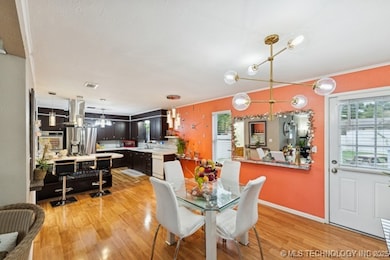
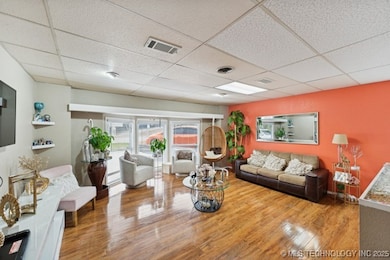
Enjoy this home, right off the highway and convenience. Garage converted to den with wet bar, nice bay windows, large kitchen with lots of cabinet and work space, new tilt-in windows, decks in back yard.
Home Details
Home Type
- Single Family
Est. Annual Taxes
- $814
Year Built
- Built in 1956
Lot Details
- 10,318 Sq Ft Lot
- East Facing Home
- Property is Fully Fenced
- Privacy Fence
- Corner Lot
Home Design
- Brick Exterior Construction
- Wood Frame Construction
- Fiberglass Roof
- Vinyl Siding
- Asphalt
Interior Spaces
- 1,601 Sq Ft Home
- 1-Story Property
- Aluminum Window Frames
- Crawl Space
- Fire and Smoke Detector
- Washer Hookup
Kitchen
- Convection Oven
- Cooktop
- Dishwasher
- Laminate Countertops
- Disposal
Flooring
- Carpet
- Tile
Bedrooms and Bathrooms
- 3 Bedrooms
Eco-Friendly Details
- Energy-Efficient Insulation
Outdoor Features
- Deck
- Shed
- Porch
Schools
- Macarthur Elementary School
- Hale Middle School
- Hale High School
Utilities
- Zoned Heating and Cooling
- Heating System Uses Gas
- Gas Water Heater
- Cable TV Available
Community Details
- No Home Owners Association
- Boman Acres IV Addn Subdivision
Map
Home Values in the Area
Average Home Value in this Area
Tax History
| Year | Tax Paid | Tax Assessment Tax Assessment Total Assessment is a certain percentage of the fair market value that is determined by local assessors to be the total taxable value of land and additions on the property. | Land | Improvement |
|---|---|---|---|---|
| 2024 | $1,166 | $9,644 | $1,261 | $8,383 |
| 2023 | $1,166 | $9,185 | $2,111 | $7,074 |
| 2022 | $1,225 | $9,185 | $2,111 | $7,074 |
| 2021 | $1,213 | $9,185 | $2,111 | $7,074 |
| 2020 | $1,197 | $9,185 | $2,111 | $7,074 |
| 2019 | $1,381 | $10,082 | $1,873 | $8,209 |
| 2018 | $1,340 | $9,759 | $1,813 | $7,946 |
| 2017 | $1,295 | $10,446 | $1,941 | $8,505 |
| 2016 | $1,268 | $10,446 | $1,941 | $8,505 |
| 2015 | $1,271 | $10,446 | $1,941 | $8,505 |
| 2014 | $1,258 | $10,446 | $1,941 | $8,505 |
Property History
| Date | Event | Price | List to Sale | Price per Sq Ft |
|---|---|---|---|---|
| 11/03/2025 11/03/25 | For Sale | $230,000 | -- | $144 / Sq Ft |
Purchase History
| Date | Type | Sale Price | Title Company |
|---|---|---|---|
| Quit Claim Deed | -- | None Listed On Document | |
| Warranty Deed | $83,500 | Titan Title & Closing Llc | |
| Contract Of Sale | $85,000 | None Available | |
| Warranty Deed | $80,000 | Tulsa Abstract & Title Co | |
| Deed | $52,000 | -- | |
| Deed | $26,000 | -- |
Mortgage History
| Date | Status | Loan Amount | Loan Type |
|---|---|---|---|
| Previous Owner | $92,504 | Commercial | |
| Previous Owner | $83,500 | Seller Take Back |
Source: MLS Technology
MLS Number: 2545748
APN: 04175-93-14-07360
Disclaimer: Certain information contained herein is derived from information provided by parties other than Homes.com. All information provided is deemed reliable, but is not guaranteed to be accurate and should be independently verified.
![]() IDX information is provided exclusively for personal, non-commercial use, and may not be used for any purpose other than to identify prospective properties consumers may be interested in purchasing.
IDX information is provided exclusively for personal, non-commercial use, and may not be used for any purpose other than to identify prospective properties consumers may be interested in purchasing.
Information is deemed reliable but not guaranteed.
- 7710 E 30th St
- 7790 E 28th Ct
- 7459 E 31st St
- 7449 E 30th Place
- 7925 E 27th Ct
- 7424 E 30th Place
- 7548 E 27th Place
- 2728 S 79th East Ave
- 2724 S 80th East Ave
- 2833 S 72nd East Ave
- 7923 E 26th Place
- 3122 S 70th East Ave
- 2605 E 74th Place
- 8703 E 29th St
- 2844 S 67th East Ave
- 3112 S 88th East Ave
- 3622 S 82nd East Ave
- 6709 E 26th Ct
- 2813 S 88th East Ave
- 8705 E 27th St Unit 2
- 7901 E 31st Ct
- 2843 S 66th East Ave
- 8205 E 22nd St
- 2616 S Sheridan Rd
- 8181 E 41st St
- 1785 S 79th Ave E
- 7625 E 21st St
- 3272 S Lakewood Ave
- 6221 E 38th St
- 3625 S Lakewood Ave
- 5846 E 22nd St
- 6621 E 19th St
- 9832 E 37th St
- 1544 S 67th East Ave
- 1412 S 73rd Ave E
- 5303 E 32nd Place Unit A
- 5810 E Skelly Dr
- 4980 E 27th St
- 4319 S Maplewood Ave
- 7845 E 49th St
