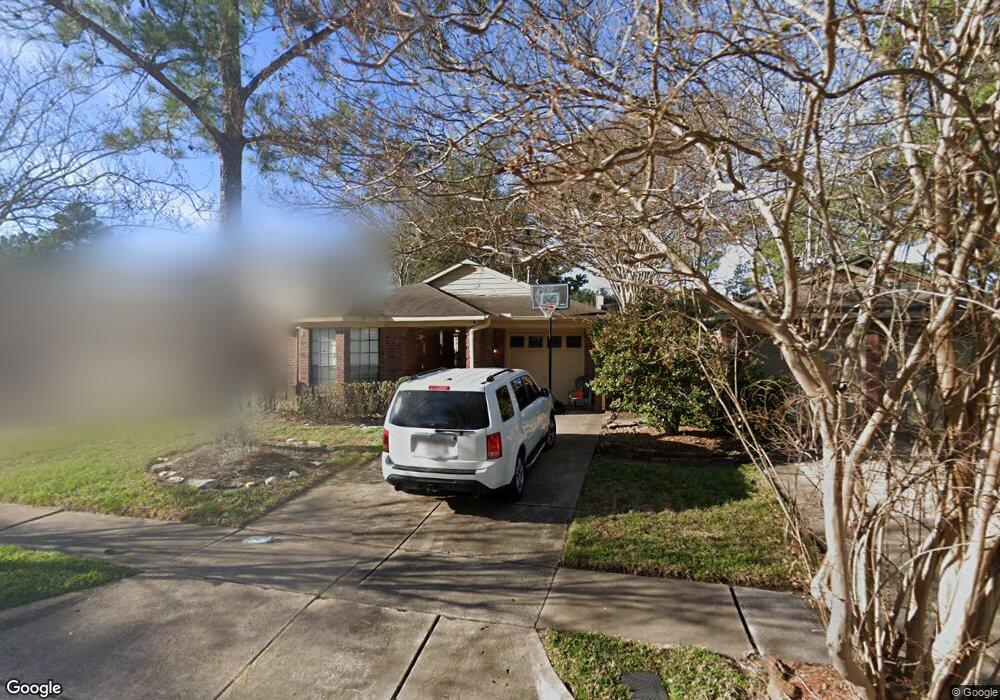
7731 High Village Dr Houston, TX 77095
Copperfield NeighborhoodEstimated Value: $221,864 - $243,000
3
Beds
2
Baths
1,301
Sq Ft
$181/Sq Ft
Est. Value
About This Home
This home is located at 7731 High Village Dr, Houston, TX 77095 and is currently estimated at $235,466, approximately $180 per square foot. 7731 High Village Dr is a home located in Harris County with nearby schools including Lowery Elementary School, Aragon Middle School, and Langham Creek High School.
Ownership History
Date
Name
Owned For
Owner Type
Purchase Details
Closed on
Nov 9, 2006
Sold by
Blake Rebecca A
Bought by
Janosky David A
Current Estimated Value
Purchase Details
Closed on
Jun 24, 2002
Sold by
Terry Nyda Rae Powers
Bought by
Blake Rebecca A
Home Financials for this Owner
Home Financials are based on the most recent Mortgage that was taken out on this home.
Original Mortgage
$75,200
Interest Rate
6.89%
Purchase Details
Closed on
Dec 9, 1998
Sold by
Wychopen Hal G and Wychopen Linda Cherie
Bought by
Powers George W and Powers Juanita
Home Financials for this Owner
Home Financials are based on the most recent Mortgage that was taken out on this home.
Original Mortgage
$30,100
Interest Rate
6.81%
Create a Home Valuation Report for This Property
The Home Valuation Report is an in-depth analysis detailing your home's value as well as a comparison with similar homes in the area
Home Values in the Area
Average Home Value in this Area
Purchase History
| Date | Buyer | Sale Price | Title Company |
|---|---|---|---|
| Janosky David A | -- | Fidelity National Title | |
| Blake Rebecca A | -- | Stewart Title | |
| Powers George W | -- | Alamo Title |
Source: Public Records
Mortgage History
| Date | Status | Borrower | Loan Amount |
|---|---|---|---|
| Previous Owner | Blake Rebecca A | $75,200 | |
| Previous Owner | Powers George W | $30,100 |
Source: Public Records
Tax History Compared to Growth
Tax History
| Year | Tax Paid | Tax Assessment Tax Assessment Total Assessment is a certain percentage of the fair market value that is determined by local assessors to be the total taxable value of land and additions on the property. | Land | Improvement |
|---|---|---|---|---|
| 2025 | $4,314 | $195,000 | $56,580 | $138,420 |
| 2024 | $4,314 | $211,488 | $56,580 | $154,908 |
| 2023 | $4,314 | $222,300 | $56,580 | $165,720 |
| 2022 | $4,320 | $191,266 | $37,720 | $153,546 |
| 2021 | $3,609 | $155,463 | $37,720 | $117,743 |
| 2020 | $3,835 | $162,663 | $28,980 | $133,683 |
| 2019 | $3,427 | $138,839 | $25,530 | $113,309 |
| 2018 | $1,843 | $127,979 | $25,530 | $102,449 |
| 2017 | $3,113 | $135,713 | $25,530 | $110,183 |
| 2016 | $2,796 | $121,881 | $25,530 | $96,351 |
| 2015 | $1,662 | $113,748 | $25,530 | $88,218 |
| 2014 | $1,662 | $103,970 | $21,390 | $82,580 |
Source: Public Records
Map
Nearby Homes
- 7719 Woodlett Ct
- 16030 Royal Garden Dr
- 16502 Rainbow Lake Rd
- 16114 Kintyre Point Rd
- 16026 Autumn Falls Ln
- 16215 Cairngorm Ave
- 7519 Sunlight Ln
- 16319 Chimneystone Dr
- 16215 Wemyss Bay Rd
- 7511 Marble Glen Ln
- 16346 Pebbleglen Dr
- 7607 Plumtree Forest Cir
- 16315 Battlecreek Dr
- 15854 Knolls Lodge Dr
- 7614 Mccormick Mill Ct
- 7622 Mccormick Mill Ct
- 7311 Postwick Ct
- 7419 Foxton Place Ct
- 7411 Marble Glen Ln
- 7414 Starbridge Dr
- 7727 High Village Dr
- 7735 High Village Dr
- 7723 High Village Dr
- 7722 Park Falls Dr
- 7718 Park Falls Dr
- 7719 High Village Dr
- 7714 Park Falls Dr
- 7730 High Village Dr
- 7734 High Village Dr
- 7715 High Village Dr Unit 227
- 7726 High Village Dr
- 7722 High Village Dr
- 7710 Park Falls Dr
- 7739 High Village Dr
- 7718 High Village Dr Unit 220
- 7730 Park Falls Dr
- 7711 High Village Dr
- 7741 High Village Dr
- 7706 Park Falls Dr
- 7740 High Village Dr