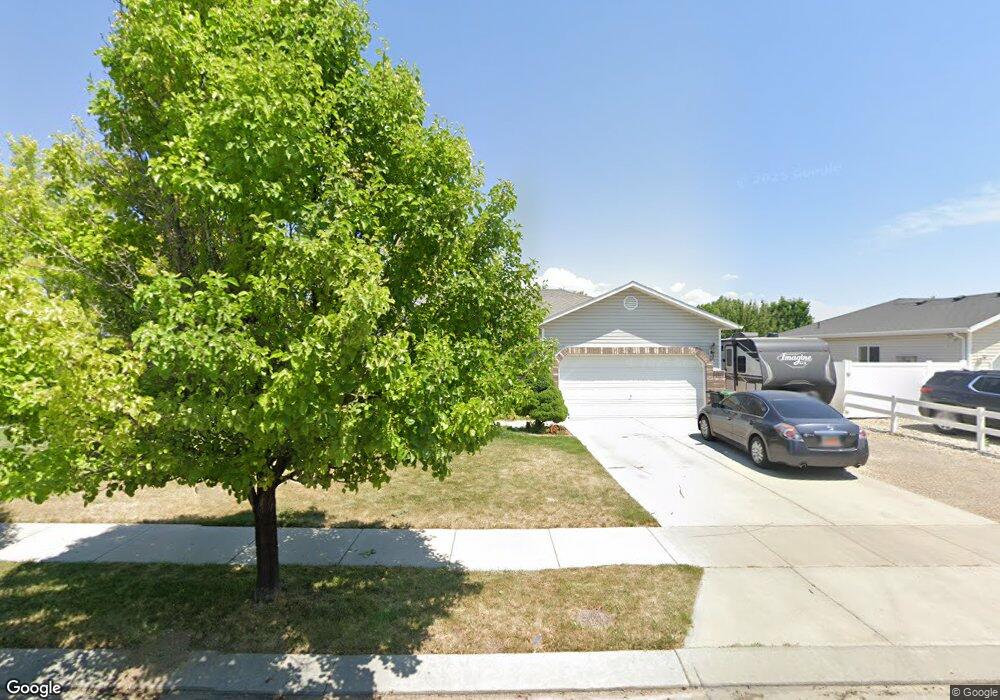
7731 S 5080 W West Jordan, UT 84081
Shadow Mountain NeighborhoodEstimated Value: $566,000 - $618,000
3
Beds
2
Baths
2,776
Sq Ft
$213/Sq Ft
Est. Value
About This Home
This home is located at 7731 S 5080 W, West Jordan, UT 84081 and is currently estimated at $590,742, approximately $212 per square foot. 7731 S 5080 W is a home located in Salt Lake County with nearby schools including Hayden Peak Elementary School, West Hills Middle School, and Copper Hills High School.
Ownership History
Date
Name
Owned For
Owner Type
Purchase Details
Closed on
Aug 11, 2009
Sold by
Hirschi Brad L and Hirschi Erin N
Bought by
Hirschi Bradlee S and Hirschi Erin N
Current Estimated Value
Home Financials for this Owner
Home Financials are based on the most recent Mortgage that was taken out on this home.
Original Mortgage
$264,286
Outstanding Balance
$173,105
Interest Rate
5.3%
Mortgage Type
FHA
Estimated Equity
$417,637
Purchase Details
Closed on
Sep 28, 2006
Sold by
Jones Brandon L and Jones Angela
Bought by
Hirschi Brad L and Hirschi Erin N
Home Financials for this Owner
Home Financials are based on the most recent Mortgage that was taken out on this home.
Original Mortgage
$40,875
Interest Rate
6.44%
Mortgage Type
Credit Line Revolving
Purchase Details
Closed on
Mar 15, 2001
Sold by
Design Builders Lc
Bought by
Jones Brandon L and Jones Angela
Home Financials for this Owner
Home Financials are based on the most recent Mortgage that was taken out on this home.
Original Mortgage
$178,908
Interest Rate
7.11%
Mortgage Type
VA
Purchase Details
Closed on
Sep 1, 1998
Sold by
Kfp Corp
Bought by
Design Builders L C
Home Financials for this Owner
Home Financials are based on the most recent Mortgage that was taken out on this home.
Original Mortgage
$30,730
Interest Rate
6.93%
Create a Home Valuation Report for This Property
The Home Valuation Report is an in-depth analysis detailing your home's value as well as a comparison with similar homes in the area
Home Values in the Area
Average Home Value in this Area
Purchase History
| Date | Buyer | Sale Price | Title Company |
|---|---|---|---|
| Hirschi Bradlee S | -- | Guardian Title | |
| Hirschi Brad L | -- | Title Ins Agcy Inc | |
| Jones Brandon L | -- | Merrill Title | |
| Design Builders L C | -- | -- |
Source: Public Records
Mortgage History
| Date | Status | Borrower | Loan Amount |
|---|---|---|---|
| Open | Hirschi Bradlee S | $264,286 | |
| Closed | Hirschi Brad L | $40,875 | |
| Previous Owner | Jones Brandon L | $178,908 | |
| Previous Owner | Design Builders L C | $30,730 |
Source: Public Records
Tax History Compared to Growth
Tax History
| Year | Tax Paid | Tax Assessment Tax Assessment Total Assessment is a certain percentage of the fair market value that is determined by local assessors to be the total taxable value of land and additions on the property. | Land | Improvement |
|---|---|---|---|---|
| 2025 | $2,679 | $521,100 | $160,600 | $360,500 |
| 2024 | $2,679 | $515,400 | $154,400 | $361,000 |
| 2023 | $2,679 | $466,600 | $148,500 | $318,100 |
| 2022 | $2,673 | $476,800 | $145,600 | $331,200 |
| 2021 | $2,363 | $383,800 | $112,000 | $271,800 |
| 2020 | $2,239 | $341,200 | $103,000 | $238,200 |
| 2019 | $2,195 | $328,000 | $97,200 | $230,800 |
| 2018 | $2,021 | $299,500 | $97,200 | $202,300 |
| 2017 | $1,973 | $291,200 | $97,200 | $194,000 |
| 2016 | $1,772 | $245,700 | $102,100 | $143,600 |
| 2015 | $1,813 | $245,100 | $109,300 | $135,800 |
| 2014 | $1,769 | $235,400 | $105,800 | $129,600 |
Source: Public Records
Map
Nearby Homes
- 7908 Cold Stone Ln Unit N3
- 7882 S Dove Creek Ln Unit A6
- 5189 W Dove Creek Ln
- 5183 W Swift Water Way
- 5228 W Ranches Loop Rd
- 5298 W Icehouse Way
- 7414 Regal Hill Dr
- 7563 S Opal Mountain Way W Unit 306
- 7567 S Opal Mountain Way W Unit 307
- 7556 S Opal Mountain Way W Unit 311
- 7569 S Opal Mountain Way W Unit 308
- 7554 S Opal Mountain Way W Unit 310
- 7553 S Opal Mountain Way W Unit 302
- 7877 S 5440 W Unit 119
- 7502 S Lace Wood Dr Unit 417
- 4678 Emmons Dr
- 7493 S Lace Wood Dr
- 6880 S Survey Peak Ln
- 6884 S Survey Peak Ln
- 6888 S Survey Peak Ln