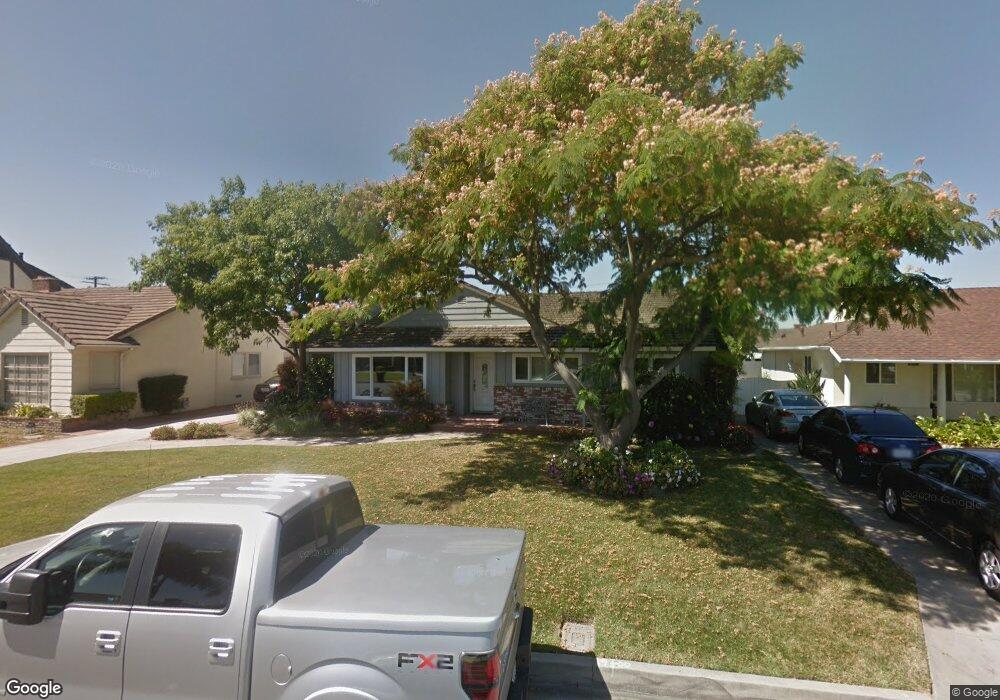
7732 Cecilia St Downey, CA 90241
Estimated Value: $1,041,000 - $1,188,000
3
Beds
2
Baths
2,010
Sq Ft
$547/Sq Ft
Est. Value
About This Home
This home is located at 7732 Cecilia St, Downey, CA 90241 and is currently estimated at $1,098,832, approximately $546 per square foot. 7732 Cecilia St is a home located in Los Angeles County with nearby schools including Rio Hondo Elementary School, Griffiths Middle School, and Warren High School.
Ownership History
Date
Name
Owned For
Owner Type
Purchase Details
Closed on
Jan 27, 2020
Sold by
Spearman Dennis M and Spearman Vicki
Bought by
Spearman Dennis M and Spearman Vicki
Current Estimated Value
Home Financials for this Owner
Home Financials are based on the most recent Mortgage that was taken out on this home.
Original Mortgage
$400,000
Interest Rate
3.7%
Mortgage Type
New Conventional
Purchase Details
Closed on
Jan 16, 2002
Sold by
Spearman Dennis M
Bought by
Spearman Dennis M and Spearman Vicki
Purchase Details
Closed on
Oct 18, 2001
Sold by
Spearman Dennis M
Bought by
Spearman Dennis M and Spearman Vicki
Home Financials for this Owner
Home Financials are based on the most recent Mortgage that was taken out on this home.
Original Mortgage
$200,000
Interest Rate
6.87%
Purchase Details
Closed on
Nov 22, 1999
Sold by
Spearman Dennis M
Bought by
The Dennis Michael & Vicki Spearman Revo
Create a Home Valuation Report for This Property
The Home Valuation Report is an in-depth analysis detailing your home's value as well as a comparison with similar homes in the area
Purchase History
| Date | Buyer | Sale Price | Title Company |
|---|---|---|---|
| Spearman Dennis M | -- | None Available | |
| Spearman Dennis M | -- | Stewart Title Of Ca Inc | |
| Spearman Dennis M | -- | -- | |
| Spearman Dennis M | -- | First American Title Co | |
| The Dennis Michael & Vicki Spearman Revo | -- | -- |
Source: Public Records
Mortgage History
| Date | Status | Borrower | Loan Amount |
|---|---|---|---|
| Closed | Spearman Dennis M | $400,000 | |
| Closed | Spearman Dennis M | $200,000 |
Source: Public Records
Tax History
| Year | Tax Paid | Tax Assessment Tax Assessment Total Assessment is a certain percentage of the fair market value that is determined by local assessors to be the total taxable value of land and additions on the property. | Land | Improvement |
|---|---|---|---|---|
| 2025 | $2,959 | $200,626 | $85,982 | $114,644 |
| 2024 | $2,882 | $196,694 | $84,297 | $112,397 |
| 2023 | $2,795 | $192,839 | $82,645 | $110,194 |
| 2022 | $2,668 | $189,059 | $81,025 | $108,034 |
| 2021 | $2,590 | $185,353 | $79,437 | $105,916 |
| 2020 | $2,553 | $183,453 | $78,623 | $104,830 |
| 2019 | $2,526 | $179,857 | $77,082 | $102,775 |
| 2018 | $2,340 | $176,331 | $75,571 | $100,760 |
| 2017 | $2,298 | $172,875 | $74,090 | $98,785 |
| 2016 | $2,245 | $169,487 | $72,638 | $96,849 |
| 2015 | $2,213 | $166,942 | $71,547 | $95,395 |
| 2014 | $2,105 | $163,673 | $70,146 | $93,527 |
Source: Public Records
Map
Nearby Homes
- 10520 Wiley Burke Ave
- 11033 Old River School Rd Unit 8
- 10308 Morning Ave
- 8110 3rd St
- 7513 Pivot St
- 10253 Hopeland Ave
- 10246 Julius Ave
- 11523 Richeon Ave
- 10736 La Reina Ave
- 7333 Via Rio Nido
- 10538 La Reina Ave
- 11508 Old River School Rd
- 7738 Adwen St
- 11517 Old River School Rd
- 11506 Adco Ave
- 11523 Old River School Rd
- 11614 Pruess Ave
- 7370 Neo St
- 8316 Cherokee Dr
- 10531 Dolan Ave
- 7740 Cecilia St
- 7724 Cecilia St
- 7727 Fostoria St
- 7744 Cecilia St
- 7718 Cecilia St
- 7719 Fostoria St
- 7731 Fostoria St
- 7733 Cecilia St
- 7711 Fostoria St
- 7741 Fostoria St
- 7741 Cecilia St
- 7712 Cecilia St
- 7719 Cecilia St
- 7747 Cecilia St
- 7705 Fostoria St
- 10714 Horley Ave
- 7711 Cecilia St
- 7704 Cecilia St
- 10802 Rives Ave
- 10717 Rives Ave
Your Personal Tour Guide
Ask me questions while you tour the home.