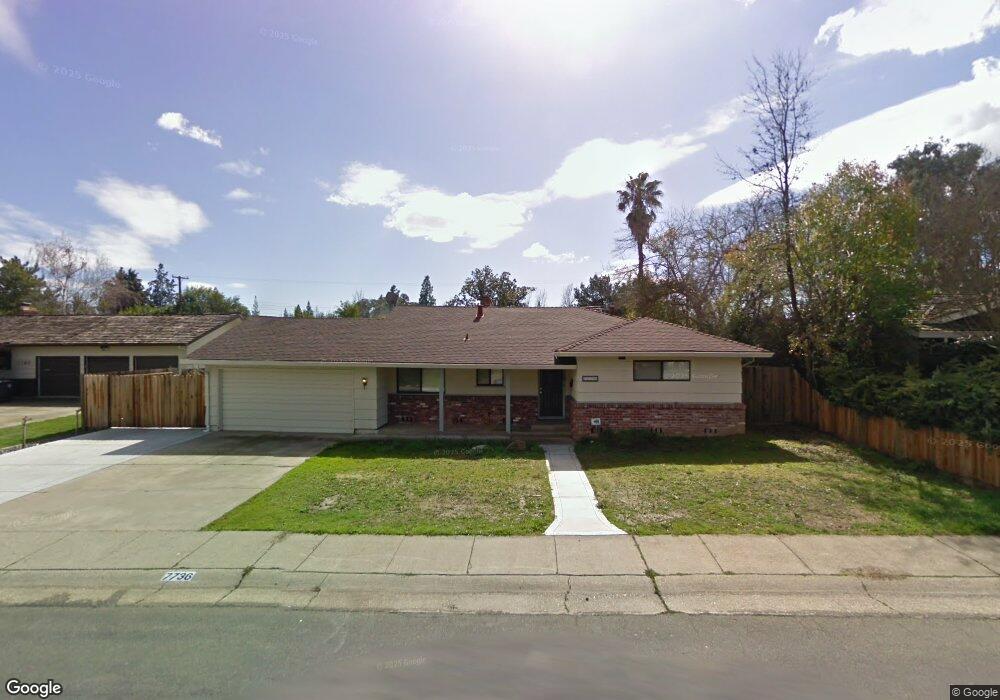
7736 Uplands Way Citrus Heights, CA 95610
Estimated Value: $568,000 - $657,000
3
Beds
2
Baths
1,477
Sq Ft
$421/Sq Ft
Est. Value
About This Home
This home is located at 7736 Uplands Way, Citrus Heights, CA 95610 and is currently estimated at $621,271, approximately $420 per square foot. 7736 Uplands Way is a home located in Sacramento County with nearby schools including Kingswood K-8, San Juan High School, and St. Mark's Lutheran Elementary School.
Ownership History
Date
Name
Owned For
Owner Type
Purchase Details
Closed on
Sep 15, 2021
Sold by
Pattison Gordon and Pattison Sylvia
Bought by
Pattison Gordon and Pattison Sylvia
Current Estimated Value
Purchase Details
Closed on
Jan 27, 2021
Sold by
Pattison Peggy
Bought by
Pattison Gordon and Pattison Sylvia
Purchase Details
Closed on
Oct 21, 2020
Sold by
Baker Robert A and Baker Michelle M
Bought by
Pattison Gordon and Pattison Sylvia
Purchase Details
Closed on
Aug 4, 2004
Sold by
Redelings Diane W and Diane W Redelings Trust
Bought by
Baker Robert A and Baker Michelle M
Home Financials for this Owner
Home Financials are based on the most recent Mortgage that was taken out on this home.
Original Mortgage
$40,000
Interest Rate
6.24%
Mortgage Type
Purchase Money Mortgage
Purchase Details
Closed on
Jan 19, 1995
Sold by
Redelings Diane W
Bought by
Redelings Diane W and Diane W Redelings Trust
Create a Home Valuation Report for This Property
The Home Valuation Report is an in-depth analysis detailing your home's value as well as a comparison with similar homes in the area
Home Values in the Area
Average Home Value in this Area
Purchase History
| Date | Buyer | Sale Price | Title Company |
|---|---|---|---|
| Pattison Gordon | -- | None Available | |
| Pattison Gordon | -- | None Available | |
| Pattison Gordon | -- | None Available | |
| Pattison Gordon | $550,000 | Placer Title Company | |
| Baker Robert A | $324,500 | Chicago Title Co | |
| Redelings Diane W | -- | -- |
Source: Public Records
Mortgage History
| Date | Status | Borrower | Loan Amount |
|---|---|---|---|
| Previous Owner | Baker Robert A | $40,000 |
Source: Public Records
Tax History Compared to Growth
Tax History
| Year | Tax Paid | Tax Assessment Tax Assessment Total Assessment is a certain percentage of the fair market value that is determined by local assessors to be the total taxable value of land and additions on the property. | Land | Improvement |
|---|---|---|---|---|
| 2025 | $6,930 | $595,336 | $151,540 | $443,796 |
| 2024 | $6,930 | $583,664 | $148,569 | $435,095 |
| 2023 | $6,752 | $572,220 | $145,656 | $426,564 |
| 2022 | $6,715 | $561,000 | $142,800 | $418,200 |
| 2021 | $6,602 | $550,000 | $140,000 | $410,000 |
| 2020 | $4,624 | $390,231 | $177,378 | $212,853 |
| 2019 | $4,440 | $375,223 | $170,556 | $204,667 |
| 2018 | $4,344 | $364,295 | $165,589 | $198,706 |
| 2017 | $4,096 | $340,464 | $154,757 | $185,707 |
| 2016 | $3,508 | $306,725 | $139,421 | $167,304 |
| 2015 | $3,267 | $286,659 | $130,300 | $156,359 |
| 2014 | $3,135 | $275,633 | $125,288 | $150,345 |
Source: Public Records
Map
Nearby Homes
- 5333 Primrose Dr Unit 43B
- 5333 Primrose Dr
- 5333 Primrose Dr Unit 24A
- 5333 Primrose Dr Unit 40B
- 5333 Primrose Dr
- 7632 Capricorn Dr
- 7746 Eastgate Ave
- 5424 Mariposa Ave
- 5223 Lake Knoll Ln
- 5641 Primrose Dr
- 5136 Romero Way
- 5150 Sunrise Hills Dr
- 5617 Mariposa Ave
- 5119 Sunrise Hills Dr
- 7916 Laurelridge Ct
- 7929 Wildridge Dr
- 5810 Primrose Dr
- 5325 Rimwood Dr
- 5409 Vin Rose Ct
- 5611 Seascape Ct
- 7732 Uplands Way
- 7740 Uplands Way
- 7743 Madison Ave
- 7751 Madison Ave
- 7728 Uplands Way
- 7744 Uplands Way
- 7735 Madison Ave
- 7735 Uplands Way
- 7741 Uplands Way
- 7759 Madison Ave
- 7731 Uplands Way
- 7727 Madison Ave
- 7724 Uplands Way
- 7759 Uplands Way
- 7748 Uplands Way
- 7767 Madison Ave
- 7727 Uplands Way
- 7719 Madison Ave
- 7752 Uplands Way
- 5409 Wildwood Way