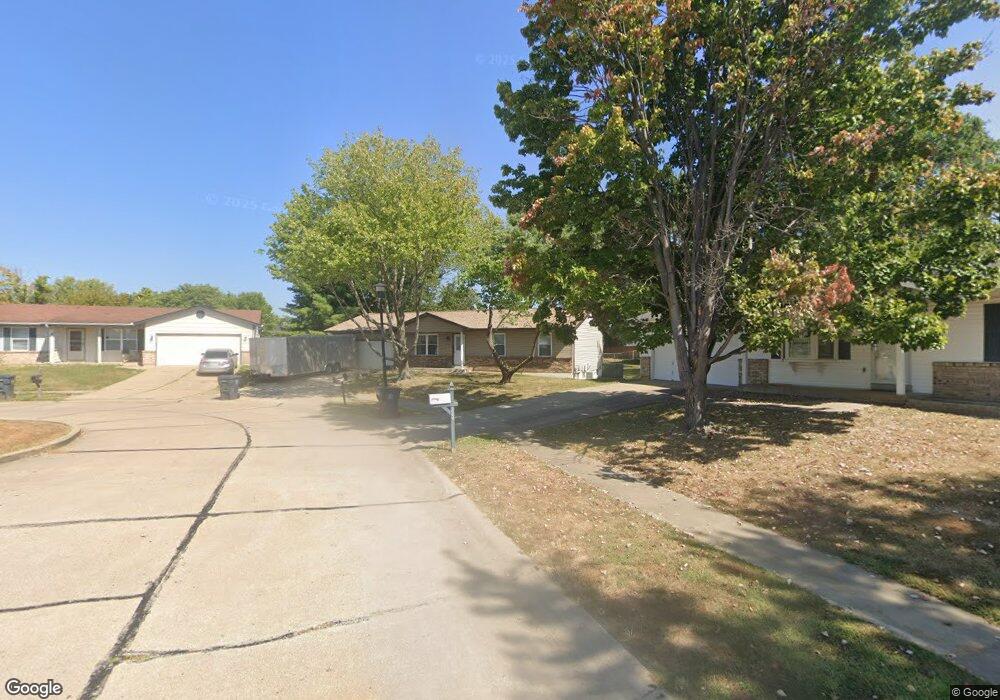
774 Haven View Ct O Fallon, MO 63366
Estimated Value: $256,417 - $283,000
3
Beds
2
Baths
988
Sq Ft
$273/Sq Ft
Est. Value
About This Home
This home is located at 774 Haven View Ct, O Fallon, MO 63366 and is currently estimated at $269,854, approximately $273 per square foot. 774 Haven View Ct is a home located in St. Charles County with nearby schools including Westhoff Elementary School, Fort Zumwalt North Middle School, and Fort Zumwalt North High School.
Ownership History
Date
Name
Owned For
Owner Type
Purchase Details
Closed on
Apr 28, 2006
Sold by
Noah Matthew and Noah Jenna
Bought by
Welker Timothy L
Current Estimated Value
Home Financials for this Owner
Home Financials are based on the most recent Mortgage that was taken out on this home.
Original Mortgage
$156,260
Outstanding Balance
$90,085
Interest Rate
6.32%
Mortgage Type
Fannie Mae Freddie Mac
Estimated Equity
$179,769
Purchase Details
Closed on
Oct 26, 2001
Sold by
Noah Matthew E and Noah Jenna M
Bought by
Noah Matthew E and Noah Jenna M
Home Financials for this Owner
Home Financials are based on the most recent Mortgage that was taken out on this home.
Original Mortgage
$106,650
Interest Rate
6.77%
Purchase Details
Closed on
Feb 26, 1999
Sold by
Young Carl E and Young Esther C
Bought by
Noah Matthew E and Boettler Jenna M
Home Financials for this Owner
Home Financials are based on the most recent Mortgage that was taken out on this home.
Original Mortgage
$82,000
Interest Rate
6.8%
Create a Home Valuation Report for This Property
The Home Valuation Report is an in-depth analysis detailing your home's value as well as a comparison with similar homes in the area
Home Values in the Area
Average Home Value in this Area
Purchase History
| Date | Buyer | Sale Price | Title Company |
|---|---|---|---|
| Welker Timothy L | $159,200 | Inv | |
| Noah Matthew E | -- | -- | |
| Noah Matthew E | -- | -- |
Source: Public Records
Mortgage History
| Date | Status | Borrower | Loan Amount |
|---|---|---|---|
| Open | Welker Timothy L | $156,260 | |
| Previous Owner | Noah Matthew E | $106,650 | |
| Previous Owner | Noah Matthew E | $82,000 |
Source: Public Records
Tax History
| Year | Tax Paid | Tax Assessment Tax Assessment Total Assessment is a certain percentage of the fair market value that is determined by local assessors to be the total taxable value of land and additions on the property. | Land | Improvement |
|---|---|---|---|---|
| 2025 | $2,313 | $36,017 | -- | -- |
| 2023 | $2,314 | $34,704 | $0 | $0 |
| 2022 | $2,220 | $30,972 | $0 | $0 |
| 2021 | $2,222 | $30,972 | $0 | $0 |
| 2020 | $2,001 | $27,040 | $0 | $0 |
| 2019 | $2,005 | $27,040 | $0 | $0 |
| 2018 | $1,752 | $22,519 | $0 | $0 |
| 2017 | $1,720 | $22,519 | $0 | $0 |
| 2016 | $1,455 | $18,955 | $0 | $0 |
| 2015 | $1,353 | $18,955 | $0 | $0 |
| 2014 | $1,492 | $20,588 | $0 | $0 |
Source: Public Records
Map
Nearby Homes
- 31 Piepers Glen Ct
- 0 Tom Ginnever Ave
- 17 Homefield Gardens Dr
- 632 Homerun Dr Unit 33N
- 19 Homefield Gardens Dr Unit 27N
- 218 Centerfield Dr
- 805 Saint Joseph Ave
- 1612 Homefield Meadows Dr
- 730 Homerun Dr Unit 76N
- 409 Saint Joseph Ave
- 201 Allen Dr
- 508 Saint Christopher Dr
- 203 Saint Margaret Ln
- 1215 Cypress Dr
- 201 Old Schaeffer Ln
- 1715 Diamond Ridge Ct
- 621 Zumwalt Crossing
- 122 Courtfield Dr
- 333 Villa Tuscany Ct Unit 5B
- 1805 Sapling Dr
- 764 Haven View Ct
- 746 Knob Hill Dr
- 738 Knob Hill Dr
- 1061 Pinewood Place Dr
- 730 Knob Hill Dr
- 754 Knob Hill Dr
- 754 Haven View Ct
- 775 Haven View Ct
- 771 Haven View Ct
- 725 Haven View Ct
- 724 Knob Hill Dr
- 7021020 Haven View Ct
- 744 Haven View Ct
- 745 Knob Hill Dr
- 735 Knob Hill Dr
- 1151 Pinewood Place Dr
- 725 Knob Hill Dr
- 734 Haven View Ct
- 714 Knob Hill Dr
Your Personal Tour Guide
Ask me questions while you tour the home.