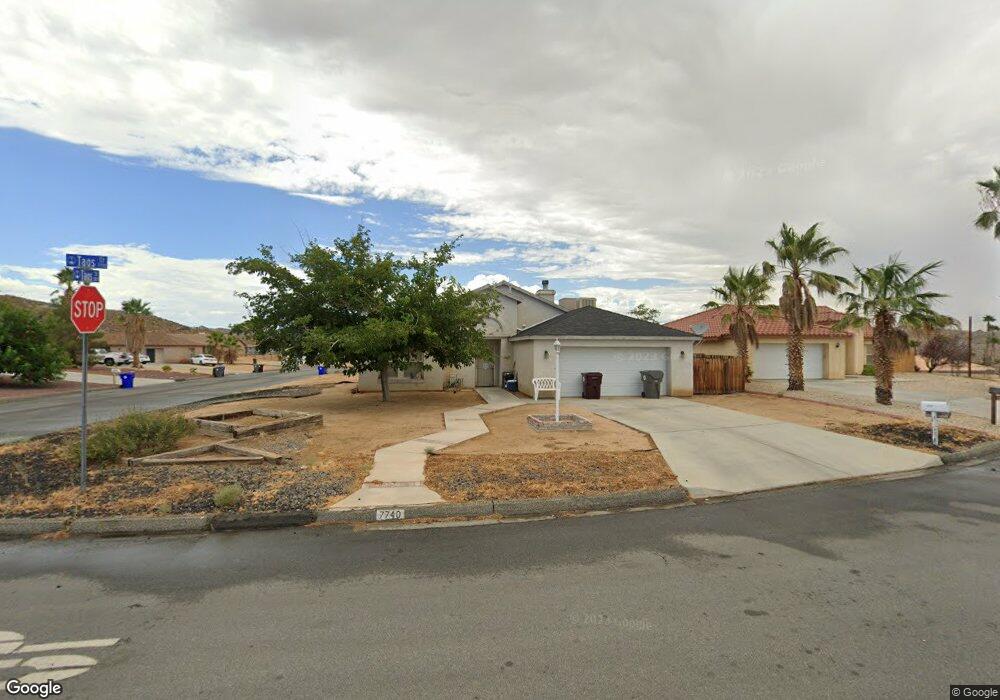
7740 Taos Ct Yucca Valley, CA 92284
Estimated Value: $334,846 - $377,000
3
Beds
2
Baths
1,283
Sq Ft
$276/Sq Ft
Est. Value
About This Home
This home is located at 7740 Taos Ct, Yucca Valley, CA 92284 and is currently estimated at $354,462, approximately $276 per square foot. 7740 Taos Ct is a home located in San Bernardino County with nearby schools including Onaga Elementary School, La Contenta Middle School, and Yucca Valley High School.
Ownership History
Date
Name
Owned For
Owner Type
Purchase Details
Closed on
Aug 12, 2011
Sold by
Nickens Heather
Bought by
Nickens Heather and The Holmes Trust
Current Estimated Value
Purchase Details
Closed on
Jun 17, 2005
Sold by
Holmes Jacqueline
Bought by
Holmes Jacqueline S and Holmes Trust
Purchase Details
Closed on
Mar 21, 2005
Sold by
Brown Stephanie and Anderson Stephanie
Bought by
Holmes Jacqueline
Purchase Details
Closed on
Dec 17, 1999
Sold by
Copper Hill Homes Llc
Bought by
Anderson Robert B and Anderson Stephanie
Home Financials for this Owner
Home Financials are based on the most recent Mortgage that was taken out on this home.
Original Mortgage
$87,478
Interest Rate
7.72%
Mortgage Type
FHA
Create a Home Valuation Report for This Property
The Home Valuation Report is an in-depth analysis detailing your home's value as well as a comparison with similar homes in the area
Home Values in the Area
Average Home Value in this Area
Purchase History
| Date | Buyer | Sale Price | Title Company |
|---|---|---|---|
| Nickens Heather | -- | None Available | |
| Holmes Jacqueline S | -- | -- | |
| Holmes Jacqueline | $210,000 | New Century Title Company | |
| Brown Stephanie | -- | New Century Title Company | |
| Anderson Robert B | $88,500 | First American Title Ins Co |
Source: Public Records
Mortgage History
| Date | Status | Borrower | Loan Amount |
|---|---|---|---|
| Previous Owner | Anderson Robert B | $87,478 |
Source: Public Records
Tax History Compared to Growth
Tax History
| Year | Tax Paid | Tax Assessment Tax Assessment Total Assessment is a certain percentage of the fair market value that is determined by local assessors to be the total taxable value of land and additions on the property. | Land | Improvement |
|---|---|---|---|---|
| 2025 | $3,349 | $159,031 | $43,114 | $115,917 |
| 2024 | $3,349 | $155,913 | $42,269 | $113,644 |
| 2023 | $3,112 | $152,856 | $41,440 | $111,416 |
| 2022 | $3,151 | $149,858 | $40,627 | $109,231 |
| 2021 | $3,246 | $146,919 | $39,830 | $107,089 |
| 2020 | $2,576 | $145,413 | $39,422 | $105,991 |
| 2019 | $2,423 | $142,562 | $38,649 | $103,913 |
| 2018 | $2,108 | $139,766 | $37,891 | $101,875 |
| 2017 | $1,733 | $137,025 | $37,148 | $99,877 |
| 2016 | $1,701 | $134,339 | $36,420 | $97,919 |
| 2015 | $1,664 | $132,321 | $35,873 | $96,448 |
| 2014 | $1,612 | $127,000 | $32,000 | $95,000 |
Source: Public Records
Map
Nearby Homes
- 7728 Balsa Ave
- 7592 Hanford Ave
- 9272 Emerson Ave
- 0 Navajo Trail Unit 219133849DA
- 7495 Balsa Ave
- 5280 Hilton Ave
- 7625 Hilton Ave
- 7504 Balsa Ave
- 57910 Joshua Dr
- 7475 Alaba Ave
- 0 Emerson Ave Unit PW25218189
- 0 Emerson Ave Unit OC25111587
- 58327 Joshua Dr
- 2333 Bonita Trail
- 8776 Warren Vista Ave
- 8804 Warren Vista Ave
- 58328 Anaconda Dr
- 58328 Bonanza Dr
- 7442 Camarilla Ave
- 7220 Hanford Ave
- 7732 Taos Ct
- 58242 Taos Trail
- 58253 Taos Trail
- 7738 Taos Ct
- 58265 Taos Trail
- 7739 Taos Ct
- 58241 Taos Trail
- 7721 Balsa Ave
- 58283 Taos Trail
- 7731 Taos Ct
- 58299 Taos Trail
- 7723 Taos Ct
- 7742 Balsa Ave
- 58268 Navajo Trail
- 58254 Navajo Trail
- 7748 Balsa Ave
- 58284 Navajo Trail
- 58311 Taos Trail
- 58238 Navajo Trail
- 7732 Megan Ct