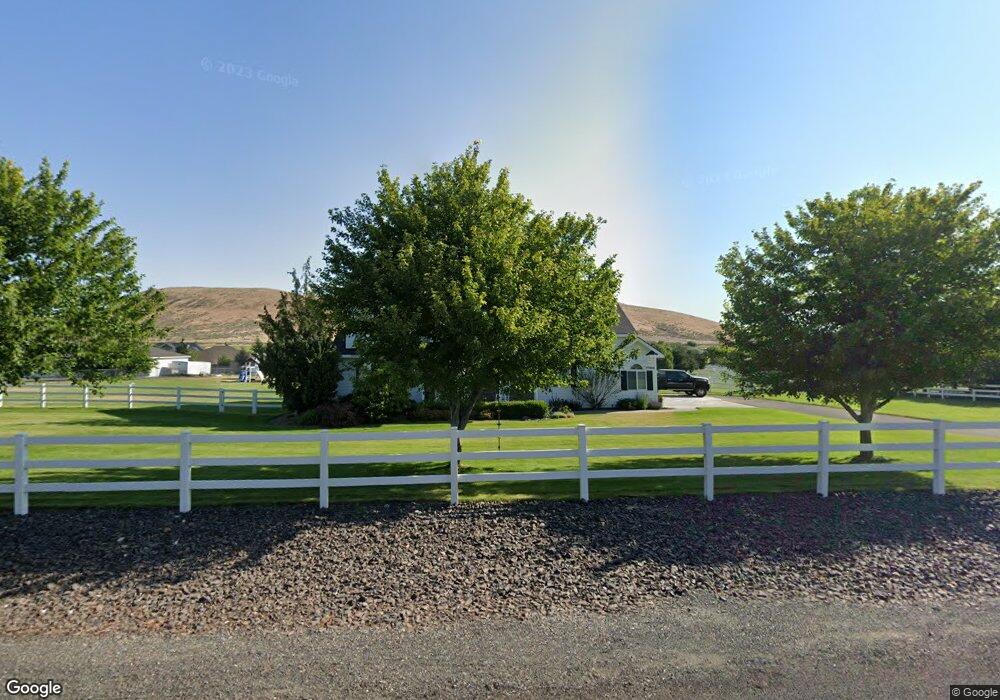
77404 E Badger Meadow Dr Unit Country Charmer ~ Qu Kennewick, WA 99338
Estimated Value: $850,980 - $1,093,000
4
Beds
4
Baths
3,381
Sq Ft
$285/Sq Ft
Est. Value
About This Home
This home is located at 77404 E Badger Meadow Dr Unit Country Charmer ~ Qu, Kennewick, WA 99338 and is currently estimated at $963,745, approximately $285 per square foot. 77404 E Badger Meadow Dr Unit Country Charmer ~ Qu is a home located in Benton County with nearby schools including Cottonwood Elementary School, Desert Hills Middle School, and Kamiakin High School.
Ownership History
Date
Name
Owned For
Owner Type
Purchase Details
Closed on
Jul 7, 2022
Sold by
Wright Aaron T and Wright Janet A
Bought by
Silva Steven and Silva Kristen
Current Estimated Value
Home Financials for this Owner
Home Financials are based on the most recent Mortgage that was taken out on this home.
Original Mortgage
$645,000
Outstanding Balance
$614,382
Interest Rate
5.23%
Mortgage Type
New Conventional
Estimated Equity
$349,363
Purchase Details
Closed on
Jul 9, 2019
Sold by
Barker Gregory E and Barker Linda J
Bought by
Wright Aaron T and Wright Janet A
Home Financials for this Owner
Home Financials are based on the most recent Mortgage that was taken out on this home.
Original Mortgage
$481,500
Interest Rate
3.82%
Mortgage Type
New Conventional
Purchase Details
Closed on
Jun 11, 2017
Sold by
Megna Luke T and Megna Jean M
Bought by
Baker Gregory E and Baker Linda J
Create a Home Valuation Report for This Property
The Home Valuation Report is an in-depth analysis detailing your home's value as well as a comparison with similar homes in the area
Home Values in the Area
Average Home Value in this Area
Purchase History
| Date | Buyer | Sale Price | Title Company |
|---|---|---|---|
| Silva Steven | -- | Ticor Title | |
| Wright Aaron T | $642,000 | Ticor Title Company | |
| Baker Gregory E | $425,478 | Chicago Title |
Source: Public Records
Mortgage History
| Date | Status | Borrower | Loan Amount |
|---|---|---|---|
| Open | Silva Steven | $645,000 | |
| Previous Owner | Wright Aaron T | $481,500 |
Source: Public Records
Tax History Compared to Growth
Tax History
| Year | Tax Paid | Tax Assessment Tax Assessment Total Assessment is a certain percentage of the fair market value that is determined by local assessors to be the total taxable value of land and additions on the property. | Land | Improvement |
|---|---|---|---|---|
| 2024 | $6,688 | $793,880 | $184,000 | $609,880 |
| 2023 | $6,688 | $745,260 | $184,000 | $561,260 |
| 2022 | $7,088 | $690,930 | $110,050 | $580,880 |
| 2021 | $6,363 | $652,200 | $110,050 | $542,150 |
| 2020 | $5,138 | $572,640 | $110,050 | $462,590 |
| 2019 | $4,976 | $444,070 | $110,050 | $334,020 |
| 2018 | $5,395 | $444,070 | $110,050 | $334,020 |
| 2017 | $5,038 | $400,500 | $110,050 | $290,450 |
| 2016 | $5,819 | $404,090 | $90,000 | $314,090 |
| 2015 | $5,850 | $404,090 | $90,000 | $314,090 |
| 2014 | -- | $404,090 | $90,000 | $314,090 |
| 2013 | -- | $404,090 | $90,000 | $314,090 |
Source: Public Records
Map
Nearby Homes
- 78604 E Canyon Meadow Dr
- 29404 S 816 Prairie SE
- 75029 Homestead Rd
- 75733 Homestead Rd
- 82385 Country Heights Dr
- 82503 E Wallowa Rd
- 84905 E Wallowa Rd
- 34214 S Glenn Miller Road Prairie SE
- 87069 E Haven View Prairie SE
- 86511 E Haven View Prairie SE
- 13730 S Furlong Ln
- 27509 S 932 Prairie SE
- 9915 S Grandview Ln
- 87626 E Calico Rd
- Lot 1 S Glenn Miller Prairie SE
- 27907 S 959 Prairie SE
- 89703 E Sagebrush Rd
- 3677 Nuthatch St
- 76704 E Timothy Ln
- 3741 Nuthatch St
- 77404 E Badger Meadow Dr
- 77404 S Badger Meadows Dr
- 77005 S Badger Meadows Dr
- 77706 S Badger Meadows Dr
- 77706 E Badger Meadows Dr
- 26703 E Sunset Meadows Loop
- 26703 S Sunset Meadow Loop
- 77303 S Badger Meadows Dr
- 77005 E Badger Meadow Dr
- 77405 E Canyon Meadow Dr
- 77405 Canyon Meadows Dr
- 77803 E Canyon Meadow Dr
- 77803 Canyon Meadows Dr
- 26405 S Sunset Meadow Loop
- 26405 E Sunset Meadows Loop
- 78208 E Badger Meadow Dr
- 77803 S Badger Meadows Dr
- 77803 E Badger Meadow Dr
- 78405 Canyon Meadows Dr
- 26902 E Sunset Meadows Loop