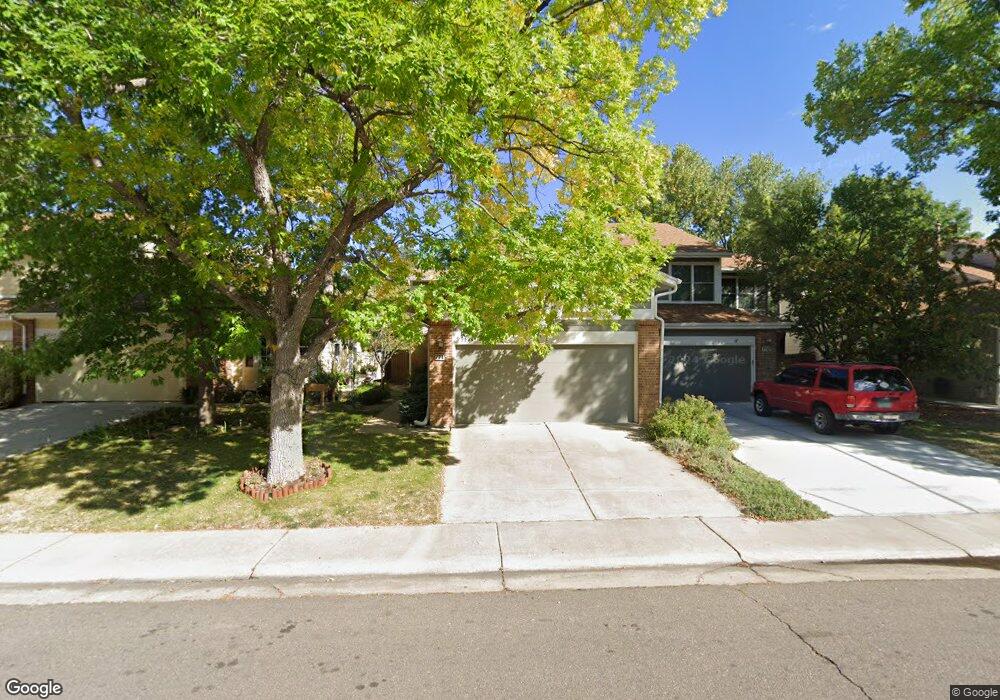
7745 E Gunnison Place Denver, CO 80231
Indian Creek NeighborhoodEstimated Value: $477,346 - $541,000
2
Beds
2
Baths
2,011
Sq Ft
$256/Sq Ft
Est. Value
About This Home
This home is located at 7745 E Gunnison Place, Denver, CO 80231 and is currently estimated at $515,337, approximately $256 per square foot. 7745 E Gunnison Place is a home located in Denver County with nearby schools including McMeen Elementary School, Hill Campus of Arts & Sciences, and George Washington High School.
Ownership History
Date
Name
Owned For
Owner Type
Purchase Details
Closed on
Jan 5, 2021
Sold by
Lipton Nathania E and Nathania E Lipton Living Trust
Bought by
Schmidt Matthew C and Maurer Marissa J
Current Estimated Value
Home Financials for this Owner
Home Financials are based on the most recent Mortgage that was taken out on this home.
Original Mortgage
$437,470
Outstanding Balance
$386,779
Interest Rate
2.7%
Mortgage Type
New Conventional
Estimated Equity
$128,558
Purchase Details
Closed on
Jul 12, 2018
Sold by
Lipton Nathania E
Bought by
Nathania E Lipton Living Trust
Purchase Details
Closed on
Dec 18, 2017
Sold by
Stall Charlotte
Bought by
Lipton Nathania E
Purchase Details
Closed on
Aug 4, 2000
Sold by
Bentz Evelyn A
Bought by
Stall Charlotte and Stall Clara B
Home Financials for this Owner
Home Financials are based on the most recent Mortgage that was taken out on this home.
Original Mortgage
$80,800
Interest Rate
8.21%
Create a Home Valuation Report for This Property
The Home Valuation Report is an in-depth analysis detailing your home's value as well as a comparison with similar homes in the area
Home Values in the Area
Average Home Value in this Area
Purchase History
| Date | Buyer | Sale Price | Title Company |
|---|---|---|---|
| Schmidt Matthew C | $451,000 | First American Title | |
| Nathania E Lipton Living Trust | -- | None Available | |
| Lipton Nathania E | $377,500 | Fidelity National Title | |
| Stall Charlotte | $220,000 | -- |
Source: Public Records
Mortgage History
| Date | Status | Borrower | Loan Amount |
|---|---|---|---|
| Open | Schmidt Matthew C | $437,470 | |
| Previous Owner | Stall Charlotte | $80,800 |
Source: Public Records
Tax History
| Year | Tax Paid | Tax Assessment Tax Assessment Total Assessment is a certain percentage of the fair market value that is determined by local assessors to be the total taxable value of land and additions on the property. | Land | Improvement |
|---|---|---|---|---|
| 2025 | $2,637 | $36,450 | $4,250 | $4,250 |
| 2024 | $2,637 | $33,290 | $360 | $32,930 |
| 2023 | $2,580 | $33,290 | $360 | $32,930 |
| 2022 | $2,064 | $25,960 | $4,190 | $21,770 |
| 2021 | $1,992 | $26,700 | $4,310 | $22,390 |
| 2020 | $2,028 | $27,340 | $4,310 | $23,030 |
| 2019 | $1,972 | $27,340 | $4,310 | $23,030 |
| 2018 | $1,140 | $21,930 | $4,340 | $17,590 |
| 2017 | $1,136 | $21,930 | $4,340 | $17,590 |
| 2016 | $1,086 | $21,280 | $3,845 | $17,435 |
| 2015 | $1,041 | $21,280 | $3,845 | $17,435 |
| 2014 | $824 | $17,880 | $3,853 | $14,027 |
Source: Public Records
Map
Nearby Homes
- 1550 S Syracuse St
- 7640 E Gunnison Place
- 1470 S Quebec Way Unit 123
- 7373 E Iowa Ave Unit 1083
- 1530 S Quebec Way Unit 30
- 1655 S Syracuse St
- 1600 S Quebec Way Unit 67
- 1469 S Ulster St
- 1699 S Trenton St Unit 13
- 1385 S Ulster St
- 7476 E Arkansas Ave Unit 3902
- 7476 E Arkansas Ave Unit 3505
- 7476 E Arkansas Ave Unit 3409
- 7476 E Arkansas Ave Unit 3510
- 7476 E Arkansas Ave Unit 3901
- 7474 E Arkansas Ave Unit 31-01
- 7474 E Arkansas Ave Unit 21-04
- 7474 E Arkansas Ave Unit 18-04
- 1762 S Trenton St Unit 6
- 1752 S Trenton St Unit 1
- 7747 E Gunnison Place
- 7707 E Gunnison Place
- 7785 E Gunnison Place
- 7705 E Gunnison Place
- 7787 E Gunnison Place
- 1551 S Spruce St
- 1552 S Syracuse St
- 1553 S Spruce St
- 7695 E Gunnison Place
- 7805 E Gunnison Place
- 1554 S Syracuse St
- 1555 S Spruce St
- 7685 E Gunnison Place
- 7815 E Gunnison Place
- 1556 S Syracuse St
- 1557 S Spruce St
- 7690 E Gunnison Place
- 1475 S Quebec Way Unit C12
- 1475 S Quebec Way
- 1475 S Quebec Way
Your Personal Tour Guide
Ask me questions while you tour the home.