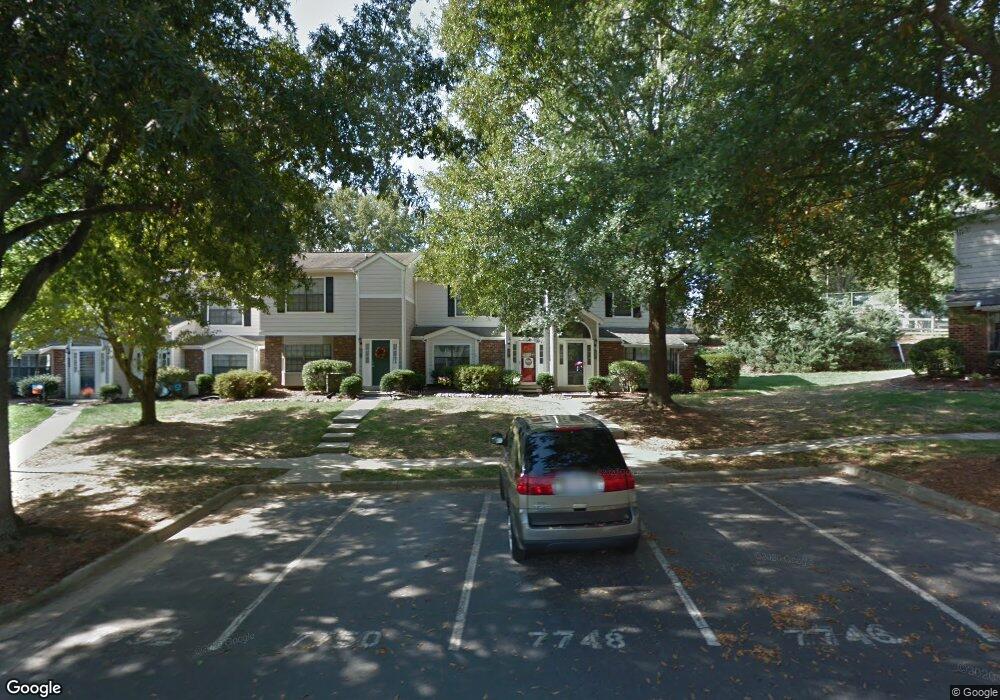
7746 Falcon Rest Cir Unit 7746 Raleigh, NC 27615
Stonehenge East NeighborhoodEstimated Value: $264,000 - $276,000
2
Beds
3
Baths
1,184
Sq Ft
$228/Sq Ft
Est. Value
About This Home
This home is located at 7746 Falcon Rest Cir Unit 7746, Raleigh, NC 27615 and is currently estimated at $269,857, approximately $227 per square foot. 7746 Falcon Rest Cir Unit 7746 is a home located in Wake County with nearby schools including Carroll Middle, Sanderson High School, and Quest Academy.
Ownership History
Date
Name
Owned For
Owner Type
Purchase Details
Closed on
Sep 17, 2019
Sold by
Troglia Loesje M
Bought by
Lawrence Leah
Current Estimated Value
Home Financials for this Owner
Home Financials are based on the most recent Mortgage that was taken out on this home.
Original Mortgage
$158,650
Outstanding Balance
$138,965
Interest Rate
3.6%
Mortgage Type
New Conventional
Estimated Equity
$130,892
Purchase Details
Closed on
Oct 21, 2014
Sold by
Troglia Charles L and Troglia Loesje M
Bought by
Troglia Loesje M
Purchase Details
Closed on
Dec 13, 2011
Sold by
Cox Ashley and Cox Bradford
Bought by
Troglia Charles L and Troglia Loesje M
Purchase Details
Closed on
Jun 30, 2004
Sold by
Daniel Mid Atlantic Properties Ii Llc
Bought by
Rainey Ashley Merit
Home Financials for this Owner
Home Financials are based on the most recent Mortgage that was taken out on this home.
Original Mortgage
$94,300
Interest Rate
5%
Mortgage Type
Unknown
Create a Home Valuation Report for This Property
The Home Valuation Report is an in-depth analysis detailing your home's value as well as a comparison with similar homes in the area
Home Values in the Area
Average Home Value in this Area
Purchase History
| Date | Buyer | Sale Price | Title Company |
|---|---|---|---|
| Lawrence Leah | $175,000 | None Available | |
| Lawrence Leah | $175,000 | None Listed On Document | |
| Troglia Loesje M | -- | None Available | |
| Troglia Charles L | $106,500 | None Available | |
| Rainey Ashley Merit | $118,000 | -- |
Source: Public Records
Mortgage History
| Date | Status | Borrower | Loan Amount |
|---|---|---|---|
| Open | Lawrence Leah | $158,650 | |
| Closed | Lawrence Leah | $158,650 | |
| Previous Owner | Rainey Ashley Merit | $94,300 |
Source: Public Records
Tax History Compared to Growth
Tax History
| Year | Tax Paid | Tax Assessment Tax Assessment Total Assessment is a certain percentage of the fair market value that is determined by local assessors to be the total taxable value of land and additions on the property. | Land | Improvement |
|---|---|---|---|---|
| 2025 | $2,434 | $276,835 | -- | $276,835 |
| 2024 | $2,424 | $276,835 | $0 | $276,835 |
| 2023 | $1,735 | $164,683 | $0 | $164,683 |
| 2022 | $1,613 | $164,683 | $0 | $164,683 |
| 2021 | $1,622 | $164,683 | $0 | $164,683 |
| 2020 | $1,523 | $164,683 | $0 | $164,683 |
| 2019 | $1,415 | $120,371 | $0 | $120,371 |
| 2018 | $1,335 | $120,371 | $0 | $120,371 |
| 2017 | $0 | $120,371 | $0 | $120,371 |
| 2016 | $0 | $120,371 | $0 | $120,371 |
| 2015 | -- | $119,587 | $0 | $119,587 |
| 2014 | -- | $119,587 | $0 | $119,587 |
Source: Public Records
Map
Nearby Homes
- 8441 Caldbeck Dr
- 2204 Middlefield Ct
- 3012 Eden Harbor Ct
- 8404 Sleepy Creek Dr
- 7820 Harbor Dr
- 8809 Barleymoor Dr
- 8113 Greywinds Dr
- 7740 Wilderness Rd
- 7741 Wilderness Rd
- 8136 Greywinds Dr
- 8337 Greywinds Dr
- 8320 Greywinds Dr
- 8401 Framingham Ct
- 8605 Brookdale Dr
- 813 Vestavia Woods Dr
- 7601 Valview St
- 8700 Aldersgate Way
- 1309 Hillbrow Ln Unit 303
- 1423 Mahonia Ct
- 1417 Quarter Point
- 7744 Falcon Rest Cir Unit 7744
- 7925 Falcon Rest Cir Unit 2408
- 7925 Falcon Rest Cir Unit 7925
- 7748 Falcon Rest Cir Unit 7748
- 7740 Falcon Rest Cir Unit 7740
- 7740 Falcon Rest Cir
- 7750 Falcon Rest Cir Unit 7750
- 7738 Falcon Rest Cir Unit 7738
- 7752 Falcon Rest Cir
- 7918 Falcon Rest Cir Unit 7918
- 7916 Falcon Rest Cir Unit 7916
- 7914 Falcon Rest Cir Unit 7914
- 7920 Falcon Rest Cir Unit 7920
- 7912 Falcon Rest Cir Unit 7912
- 7756 Falcon Rest Cir Unit 7756
- 7922 Falcon Rest Cir Unit 7922
- 7734 Falcon Rest Cir Unit 7734
- 7758 Falcon Rest Cir Unit 7758
- 7612 Falcon Rest Cir Unit 7612
- 7612 Falcon Rest Cir Unit 1