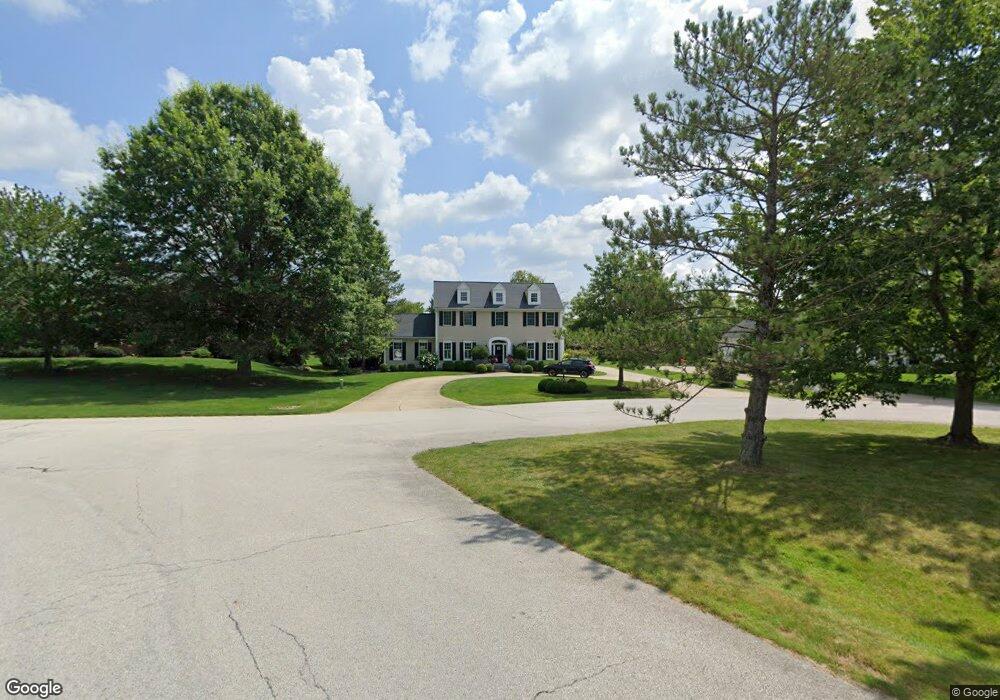
7746 Oxgate Ct Hudson, OH 44236
Estimated Value: $577,898 - $680,000
4
Beds
4
Baths
2,952
Sq Ft
$206/Sq Ft
Est. Value
About This Home
This home is located at 7746 Oxgate Ct, Hudson, OH 44236 and is currently estimated at $608,725, approximately $206 per square foot. 7746 Oxgate Ct is a home located in Summit County with nearby schools including Ellsworth Hill Elementary School, East Woods Intermediate School, and Hudson Middle School.
Ownership History
Date
Name
Owned For
Owner Type
Purchase Details
Closed on
Jun 30, 1997
Sold by
National City Bank Of Co
Bought by
Trattner Jeffrey A and Trattner Maureen B
Current Estimated Value
Home Financials for this Owner
Home Financials are based on the most recent Mortgage that was taken out on this home.
Original Mortgage
$272,000
Outstanding Balance
$30,964
Interest Rate
6%
Mortgage Type
New Conventional
Estimated Equity
$577,761
Purchase Details
Closed on
Feb 27, 1997
Sold by
Krontiris Gregory G
Bought by
National City Bank Of Columbus Trustee
Create a Home Valuation Report for This Property
The Home Valuation Report is an in-depth analysis detailing your home's value as well as a comparison with similar homes in the area
Home Values in the Area
Average Home Value in this Area
Purchase History
| Date | Buyer | Sale Price | Title Company |
|---|---|---|---|
| Trattner Jeffrey A | $275,000 | -- | |
| National City Bank Of Columbus Trustee | $275,000 | -- |
Source: Public Records
Mortgage History
| Date | Status | Borrower | Loan Amount |
|---|---|---|---|
| Open | Trattner Jeffrey A | $272,000 |
Source: Public Records
Tax History
| Year | Tax Paid | Tax Assessment Tax Assessment Total Assessment is a certain percentage of the fair market value that is determined by local assessors to be the total taxable value of land and additions on the property. | Land | Improvement |
|---|---|---|---|---|
| 2025 | $8,531 | $167,846 | $26,971 | $140,875 |
| 2024 | $8,531 | $167,846 | $26,971 | $140,875 |
| 2023 | $8,531 | $167,846 | $26,971 | $140,875 |
| 2022 | $7,302 | $128,125 | $20,587 | $107,538 |
| 2021 | $7,314 | $128,125 | $20,587 | $107,538 |
| 2020 | $7,185 | $128,130 | $20,590 | $107,540 |
| 2019 | $7,559 | $124,870 | $18,870 | $106,000 |
| 2018 | $7,532 | $124,870 | $18,870 | $106,000 |
| 2017 | $6,892 | $124,870 | $18,870 | $106,000 |
| 2016 | $6,942 | $111,000 | $18,870 | $92,130 |
| 2015 | $6,892 | $111,000 | $18,870 | $92,130 |
| 2014 | $6,912 | $111,000 | $18,870 | $92,130 |
| 2013 | $6,768 | $106,140 | $18,870 | $87,270 |
Source: Public Records
Map
Nearby Homes
- 2765 Blue Heron Dr
- 2816 Woodbridge Rd
- 7753 Red Fox Trail
- 7590 Woodland Ave
- 2396 Leeway Dr
- 2297 Olde Farm Ln
- 7350 Herrick Park Dr
- 7687 Ravenna Rd
- 2308 Glenn Echo Dr
- 8028 Megan Meadow Dr
- 1998 E Hines Hill Rd
- 10252 Wellman Rd Unit 19
- 2100 Camden Ln
- 7525 Berks Way
- 1864 E Haymarket Way
- 128 Hudson St
- 6740 Pinebrooke Dr
- 1693 Middleton Rd
- 179 Elm St
- 24 Morning Song Ln
- 7738 Oxgate Ct
- 7752 Oxgate Ct
- 7726 Oxgate Ct
- 7760 Oxgate Ct
- 7715 Oxgate Ct
- 7755 Oxgate Ct
- 7716 Oxgate Ct
- 7739 Oxgate Ct
- 7706 Oxgate Ct
- 7693 Oxgate Ct
- 2715 Parkside Dr
- 2725 Parkside Dr
- 2732 Middleton Rd
- 7696 Oxgate Ct
- 2718 Middleton Rd
- 2705 Parkside Dr
- 2724 Blue Heron Dr
- 7681 Oxgate Ct
- 2730 Blue Heron Dr
- 2735 Parkside Dr
Your Personal Tour Guide
Ask me questions while you tour the home.