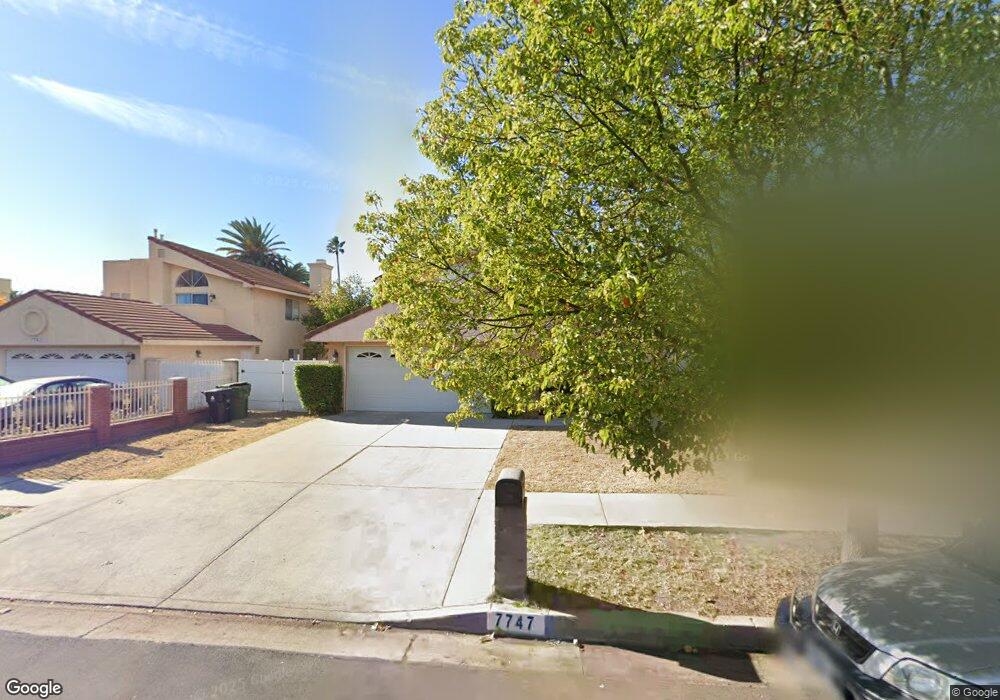
7747 Yolanda Ave Reseda, CA 91335
Estimated Value: $918,312 - $1,071,000
5
Beds
3
Baths
2,371
Sq Ft
$424/Sq Ft
Est. Value
About This Home
This home is located at 7747 Yolanda Ave, Reseda, CA 91335 and is currently estimated at $1,005,078, approximately $423 per square foot. 7747 Yolanda Ave is a home located in Los Angeles County with nearby schools including Blythe Street Elementary, Northridge Middle School, and Northridge Academy High.
Ownership History
Date
Name
Owned For
Owner Type
Purchase Details
Closed on
Jul 21, 2007
Sold by
Vu Steve Tu and Vu Steve T
Bought by
Vu Steve Tu
Current Estimated Value
Purchase Details
Closed on
Dec 19, 1998
Sold by
Tu Anh Vu and Tu Anh Tuan
Bought by
Vu Steve T
Home Financials for this Owner
Home Financials are based on the most recent Mortgage that was taken out on this home.
Original Mortgage
$130,000
Interest Rate
6.82%
Purchase Details
Closed on
Nov 14, 1994
Sold by
Texas Commerce Bank Na
Bought by
Vu Tu Anh
Home Financials for this Owner
Home Financials are based on the most recent Mortgage that was taken out on this home.
Original Mortgage
$157,600
Interest Rate
8.91%
Purchase Details
Closed on
Apr 22, 1994
Sold by
Robert E Weiss Inc
Bought by
Texas Commerce Bank National Assn
Create a Home Valuation Report for This Property
The Home Valuation Report is an in-depth analysis detailing your home's value as well as a comparison with similar homes in the area
Home Values in the Area
Average Home Value in this Area
Purchase History
| Date | Buyer | Sale Price | Title Company |
|---|---|---|---|
| Vu Steve Tu | -- | None Available | |
| Vu Steve T | -- | Fidelity National Title Ins | |
| Vu Tu Anh | $197,000 | First Southwestern Title Co | |
| Texas Commerce Bank National Assn | $195,500 | First Southwestern Title |
Source: Public Records
Mortgage History
| Date | Status | Borrower | Loan Amount |
|---|---|---|---|
| Closed | Vu Steve T | $130,000 | |
| Previous Owner | Vu Tu Anh | $157,600 |
Source: Public Records
Tax History
| Year | Tax Paid | Tax Assessment Tax Assessment Total Assessment is a certain percentage of the fair market value that is determined by local assessors to be the total taxable value of land and additions on the property. | Land | Improvement |
|---|---|---|---|---|
| 2025 | $4,338 | $333,944 | $133,459 | $200,485 |
| 2024 | $4,338 | $327,397 | $130,843 | $196,554 |
| 2023 | $4,260 | $320,978 | $128,278 | $192,700 |
| 2022 | $4,072 | $314,685 | $125,763 | $188,922 |
| 2021 | $4,012 | $308,516 | $123,298 | $185,218 |
| 2019 | $3,897 | $299,367 | $119,642 | $179,725 |
| 2018 | $3,808 | $293,498 | $117,297 | $176,201 |
| 2016 | $3,621 | $282,104 | $112,744 | $169,360 |
| 2015 | $3,571 | $277,868 | $111,051 | $166,817 |
| 2014 | $3,591 | $272,426 | $108,876 | $163,550 |
Source: Public Records
Map
Nearby Homes
- 18817 Stagg St
- 18725 Covello St
- 7641 Reseda Blvd Unit 87Z
- 7650 Wilbur Ave
- 7651 Reseda Blvd Unit 3T
- 7651 Reseda Blvd Unit 12T
- 7645 Wilbur Ave
- 7625 Reseda Blvd Unit 104
- 18800 Cohasset St
- 7444 Amigo Ave
- 18715 Valerio St
- 18425 Saticoy St Unit 4
- 18425 Saticoy St Unit 1
- 18404 Arminta St
- 18347 Saticoy St Unit 28
- 18347 Saticoy St Unit 35
- 18347 Saticoy St Unit 6
- 18347 Saticoy St Unit 24
- 18320 Ingomar St
- 7551 Donna Ave
- 7741 Yolanda Ave
- 7753 Yolanda Ave
- 7759 Yolanda Ave
- 7733 Yolanda Ave
- 7738 Rhea Ave
- 7744 Rhea Ave
- 7732 Rhea Ave
- 7750 Rhea Ave
- 18655 Stagg St
- 7765 Yolanda Ave
- 7727 Yolanda Ave
- 7726 Rhea Ave
- 18656 Ingomar St
- 7758 Rhea Ave
- 18649 Stagg St
- 7720 Rhea Ave
- 7807 Yolanda Ave
- 7800 Rhea Ave
- 18646 Ingomar St
- 18654 Stagg St
Your Personal Tour Guide
Ask me questions while you tour the home.