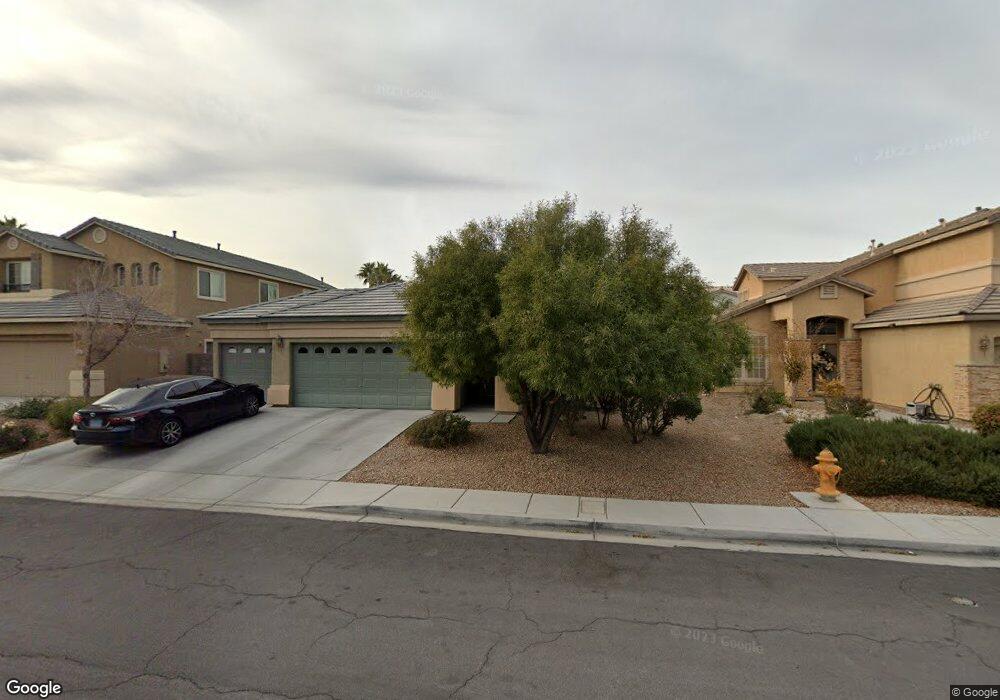
7749 Cascade Bluffs Ct Las Vegas, NV 89123
Silverado Ranch NeighborhoodEstimated Value: $459,000 - $477,000
3
Beds
2
Baths
1,626
Sq Ft
$288/Sq Ft
Est. Value
About This Home
This home is located at 7749 Cascade Bluffs Ct, Las Vegas, NV 89123 and is currently estimated at $468,647, approximately $288 per square foot. 7749 Cascade Bluffs Ct is a home located in Clark County with nearby schools including Charlotte Hill Elementary School, Louis Wiener Jr Elementary School, and Jack Lund Schofield Middle School.
Ownership History
Date
Name
Owned For
Owner Type
Purchase Details
Closed on
Apr 19, 2010
Sold by
Krynski Kenneth S
Bought by
Cajipo Genaro C and Amago Salvacion C
Current Estimated Value
Home Financials for this Owner
Home Financials are based on the most recent Mortgage that was taken out on this home.
Original Mortgage
$152,192
Outstanding Balance
$103,205
Interest Rate
5.37%
Mortgage Type
FHA
Estimated Equity
$365,442
Purchase Details
Closed on
May 21, 2007
Sold by
Hidden Crest V Llc
Bought by
Krynski Kenneth S
Home Financials for this Owner
Home Financials are based on the most recent Mortgage that was taken out on this home.
Original Mortgage
$285,332
Interest Rate
7.12%
Mortgage Type
Unknown
Purchase Details
Closed on
Feb 2, 2007
Sold by
Hidden Crest V Llc
Bought by
Hidden Crest V Homeowners Assn
Create a Home Valuation Report for This Property
The Home Valuation Report is an in-depth analysis detailing your home's value as well as a comparison with similar homes in the area
Home Values in the Area
Average Home Value in this Area
Purchase History
| Date | Buyer | Sale Price | Title Company |
|---|---|---|---|
| Cajipo Genaro C | $155,000 | Nevada Title Las Vegas | |
| Krynski Kenneth S | $342,990 | First Amer Title Co Of Nv | |
| Hidden Crest V Homeowners Assn | $571 | First Amer Title Co Of Nv |
Source: Public Records
Mortgage History
| Date | Status | Borrower | Loan Amount |
|---|---|---|---|
| Open | Cajipo Genaro C | $152,192 | |
| Previous Owner | Krynski Kenneth S | $285,332 |
Source: Public Records
Tax History Compared to Growth
Tax History
| Year | Tax Paid | Tax Assessment Tax Assessment Total Assessment is a certain percentage of the fair market value that is determined by local assessors to be the total taxable value of land and additions on the property. | Land | Improvement |
|---|---|---|---|---|
| 2025 | $2,531 | $124,564 | $42,000 | $82,564 |
| 2024 | $2,344 | $124,564 | $42,000 | $82,564 |
| 2023 | $2,344 | $110,023 | $32,200 | $77,823 |
| 2022 | $2,171 | $97,204 | $26,250 | $70,954 |
| 2021 | $2,010 | $93,488 | $26,250 | $67,238 |
| 2020 | $1,863 | $92,138 | $25,550 | $66,588 |
| 2019 | $1,746 | $89,671 | $24,500 | $65,171 |
| 2018 | $1,666 | $83,154 | $20,300 | $62,854 |
| 2017 | $2,461 | $83,912 | $20,300 | $63,612 |
| 2016 | $1,561 | $77,759 | $17,500 | $60,259 |
| 2015 | $1,557 | $51,496 | $10,500 | $40,996 |
| 2014 | $1,511 | $52,107 | $7,000 | $45,107 |
Source: Public Records
Map
Nearby Homes
- 7668 Friendly Breeze Ct
- 932 Royal Moon Ave
- 7618 Poppy Meadow St
- 7751 Radcliff St
- 7745 Radcliff St
- 884 E Robindale Rd
- 865 Buffwood Ave
- 920 Serpentina Ave
- 887 Centaur Ave
- 825 Royal Moon Ave
- 1077 Adelman Dr
- 915 Brass Ring Rd
- 7735 Maggie Belle Ct
- 1081 Overture Dr
- 7748 Maggie Belle Ct
- 747 Canyon Crest Dr
- 7400 Emerald Glow St
- 7384 Emerald Glow St
- 7585 Hartwell Dr
- 7951 Aspendale Dr
- 7739 Cascade Bluffs Ct
- 7759 Cascade Bluffs Ct
- 7754 Briana Renee Way
- 7729 Cascade Bluffs Ct
- 7744 Briana Renee Way
- 7769 Cascade Bluffs Ct
- 7748 Cascade Bluffs Ct
- 7764 Briana Renee Way
- 7734 Briana Renee Way
- 7758 Cascade Bluffs Ct
- 7738 Cascade Bluffs Ct
- 7719 Cascade Bluffs Ct
- 7768 Cascade Bluffs Ct
- 7728 Cascade Bluffs Ct
- 7779 Cascade Bluffs Ct
- 7774 Briana Renee Way Unit 1
- 7724 Briana Renee Way
- 7718 Cascade Bluffs Ct
- 7718 Cascade Bluffs Ct
- 7718 Cascade Bluffs Ct