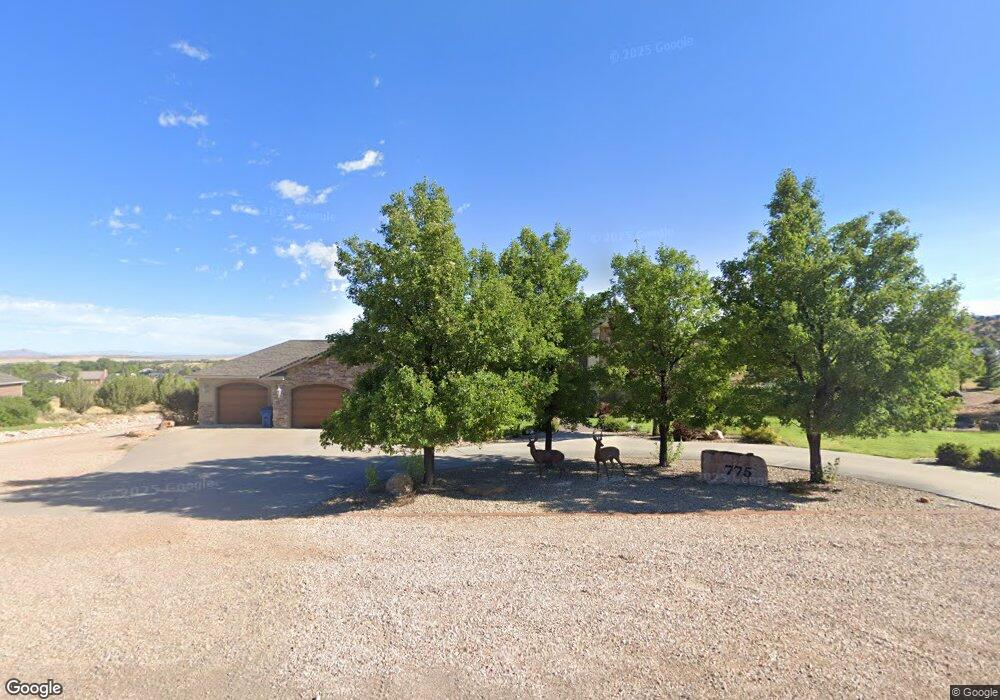
775 E 575 Rd S Fillmore, UT 84631
Estimated Value: $775,000 - $1,264,000
5
Beds
5
Baths
6,275
Sq Ft
$170/Sq Ft
Est. Value
About This Home
This home is located at 775 E 575 Rd S, Fillmore, UT 84631 and is currently estimated at $1,068,167, approximately $170 per square foot. 775 E 575 Rd S is a home located in Millard County.
Ownership History
Date
Name
Owned For
Owner Type
Purchase Details
Closed on
Jan 17, 2025
Sold by
Tod & Robi Monsen Family Trust and Monsen R
Bought by
Monsen Family Trust and Monsen
Current Estimated Value
Purchase Details
Closed on
Apr 10, 2023
Sold by
Gillins Corey and Gillins Kristen
Bought by
Tod & Robi Monsen Family Trust
Purchase Details
Closed on
Sep 14, 2020
Sold by
Miller Mark A and Miller Tammera
Bought by
Gillins Corey and Gillins Kristen
Home Financials for this Owner
Home Financials are based on the most recent Mortgage that was taken out on this home.
Original Mortgage
$510,400
Interest Rate
2.9%
Mortgage Type
New Conventional
Purchase Details
Closed on
Sep 7, 2007
Sold by
Orullian Orvil John and Orullian Sherrie Lynn
Bought by
Miller Mark A and Miller Tammera
Home Financials for this Owner
Home Financials are based on the most recent Mortgage that was taken out on this home.
Original Mortgage
$445,000
Interest Rate
6.57%
Create a Home Valuation Report for This Property
The Home Valuation Report is an in-depth analysis detailing your home's value as well as a comparison with similar homes in the area
Home Values in the Area
Average Home Value in this Area
Purchase History
| Date | Buyer | Sale Price | Title Company |
|---|---|---|---|
| Monsen Family Trust | -- | None Listed On Document | |
| Tod & Robi Monsen Family Trust | -- | Metro National Title | |
| Gillins Corey | -- | First American Title | |
| Miller Mark A | -- | -- |
Source: Public Records
Mortgage History
| Date | Status | Borrower | Loan Amount |
|---|---|---|---|
| Previous Owner | Gillins Corey | $510,400 | |
| Previous Owner | Miller Mark A | $445,000 |
Source: Public Records
Tax History Compared to Growth
Tax History
| Year | Tax Paid | Tax Assessment Tax Assessment Total Assessment is a certain percentage of the fair market value that is determined by local assessors to be the total taxable value of land and additions on the property. | Land | Improvement |
|---|---|---|---|---|
| 2025 | $6,253 | $785,367 | $51,598 | $733,769 |
| 2024 | $6,253 | $647,341 | $59,048 | $588,293 |
| 2023 | $11,264 | $647,341 | $59,048 | $588,293 |
| 2022 | $5,183 | $465,381 | $42,153 | $423,228 |
| 2021 | $4,715 | $406,499 | $33,722 | $372,777 |
| 2020 | $3,788 | $328,437 | $30,656 | $297,781 |
| 2019 | $3,204 | $278,707 | $30,656 | $248,051 |
| 2018 | $3,043 | $270,899 | $30,656 | $240,243 |
| 2017 | $3,038 | $257,092 | $30,656 | $226,436 |
| 2016 | $2,905 | $257,092 | $30,656 | $226,436 |
| 2015 | $2,906 | $257,092 | $30,656 | $226,436 |
| 2014 | -- | $257,092 | $30,656 | $226,436 |
| 2013 | -- | $257,092 | $30,656 | $226,436 |
Source: Public Records
Map
Nearby Homes
- 750 800 South Fillmore
- 825 800 South Fillmore
- 800 800 South Fillmore
- 690 E 500 S
- 310 S 600 E
- 760 E 700 St S
- 405 E 500 St S
- 430 E Canyon Rd
- 157 E 500 South St
- 155 E 500 St S
- 220 S 200 E
- 40 S 100 Rd E
- 190 W 400 St S
- 165 N 100 W
- 295 N 100 West St
- 225 W 200 St N
- 390 N 100 W
- 310 S 500 West Rd
- 380 N 200 St W
- 335 W 400 North St
- 755 E 575 S
- 590 S 800 E
- 795 E 575 Rd S
- 760 E 575 S
- 735 E 575 S
- 740 E 575 S
- 490 S 800 E Unit 14
- 585 S 800 E
- 565 S 800 E
- 535 S 800 E
- 495 S 800 E
- 725 E 575 S
- 470 Highland Dr
- 800 S S 800 East St St E
- 760 E Valley View Rd
- 760 E 440 S
- 710 E 575 S
- 645 S 700 E
- 775 E Valley View Rd
- 420 S Highland Dr Unit 9-1