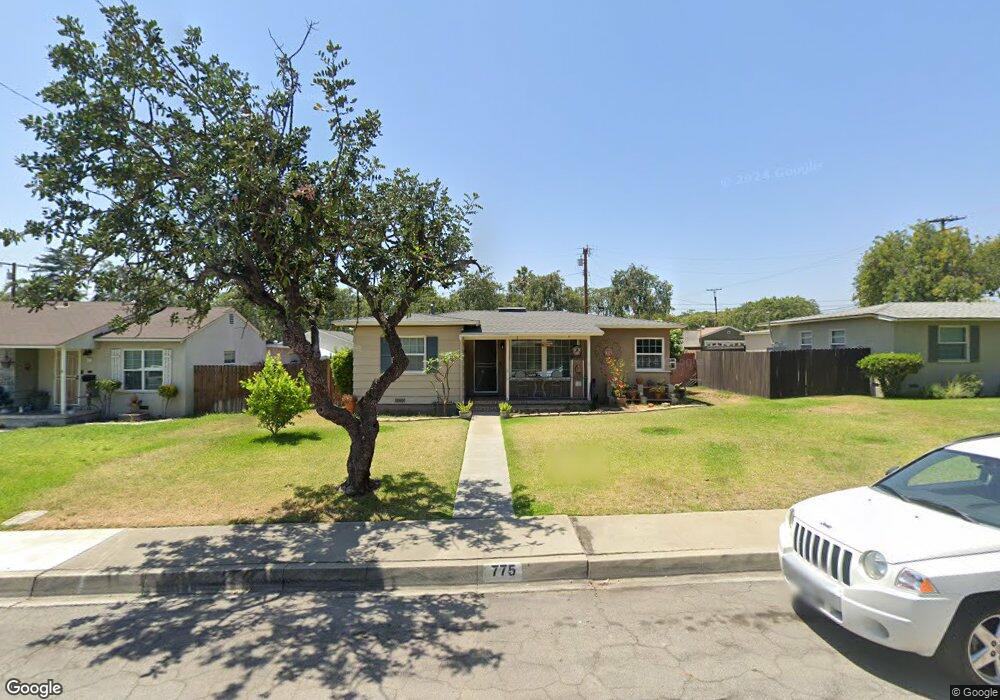
775 N Redding Way Upland, CA 91786
Estimated Value: $633,406 - $675,000
3
Beds
1
Bath
1,012
Sq Ft
$645/Sq Ft
Est. Value
About This Home
This home is located at 775 N Redding Way, Upland, CA 91786 and is currently estimated at $653,102, approximately $645 per square foot. 775 N Redding Way is a home located in San Bernardino County with nearby schools including Baldy View Elementary School, Upland Junior High School, and Upland High School.
Ownership History
Date
Name
Owned For
Owner Type
Purchase Details
Closed on
Nov 22, 2013
Sold by
Klancnik Kristopher M
Bought by
Klancnik Kristopher M and Klancnik Katherine A
Current Estimated Value
Home Financials for this Owner
Home Financials are based on the most recent Mortgage that was taken out on this home.
Original Mortgage
$208,100
Outstanding Balance
$154,013
Interest Rate
4.04%
Mortgage Type
New Conventional
Estimated Equity
$499,089
Purchase Details
Closed on
Apr 16, 2010
Sold by
Johnson Averal M
Bought by
Klancnik Kristopher M and Dias Katherine A
Home Financials for this Owner
Home Financials are based on the most recent Mortgage that was taken out on this home.
Original Mortgage
$217,076
Interest Rate
5.25%
Mortgage Type
FHA
Create a Home Valuation Report for This Property
The Home Valuation Report is an in-depth analysis detailing your home's value as well as a comparison with similar homes in the area
Home Values in the Area
Average Home Value in this Area
Purchase History
| Date | Buyer | Sale Price | Title Company |
|---|---|---|---|
| Klancnik Kristopher M | -- | Service Link | |
| Klancnik Kristopher M | $220,000 | Westminster Title |
Source: Public Records
Mortgage History
| Date | Status | Borrower | Loan Amount |
|---|---|---|---|
| Open | Klancnik Kristopher M | $208,100 | |
| Closed | Klancnik Kristopher M | $217,076 |
Source: Public Records
Tax History
| Year | Tax Paid | Tax Assessment Tax Assessment Total Assessment is a certain percentage of the fair market value that is determined by local assessors to be the total taxable value of land and additions on the property. | Land | Improvement |
|---|---|---|---|---|
| 2025 | $3,254 | $283,986 | $99,395 | $184,591 |
| 2024 | $3,151 | $278,418 | $97,446 | $180,972 |
| 2023 | $3,102 | $272,959 | $95,535 | $177,424 |
| 2022 | $3,035 | $267,607 | $93,662 | $173,945 |
| 2021 | $3,029 | $262,359 | $91,825 | $170,534 |
| 2020 | $2,947 | $259,668 | $90,883 | $168,785 |
| 2019 | $2,938 | $254,576 | $89,101 | $165,475 |
| 2018 | $2,868 | $249,584 | $87,354 | $162,230 |
| 2017 | $2,786 | $244,690 | $85,641 | $159,049 |
| 2016 | $2,594 | $239,892 | $83,962 | $155,930 |
| 2015 | $2,535 | $236,289 | $82,701 | $153,588 |
| 2014 | $2,470 | $231,660 | $81,081 | $150,579 |
Source: Public Records
Map
Nearby Homes
- 855 N Palm Ave
- 636 N Palm Ave
- 910 N Redding Way Unit I
- 910 N Redding Way Unit F
- 762 N Vallejo Way
- 617 N Ukiah Way
- 509 N Euclid Ave
- 846 Amber Ct
- 435 W 9th St Unit B3
- 856 Altura Way
- 885 W Arrow Hwy
- 0 Bay St Unit AR25093919
- 1234 N Laurel Ave
- 633 Maple Way
- 1270 N Euclid Ave
- 161 N 1st Ave
- 1318 N Laurel Ave
- 145 N 1st Ave
- 595 Juniper Ave
- 922 N 4th Ave
- 763 N Redding Way
- 795 N Redding Way
- 747 N Redding Way
- 774 N Shasta Way
- 762 N Shasta Way
- 796 N Shasta Way
- 358 W 11th St
- 774 N Redding Way
- 744 N Shasta Way
- 790 N Redding Way
- 731 N Redding Way
- 744 N Redding Way
- 730 N Shasta Way
- 719 N Redding Way
- 730 N Redding Way
- 716 N Shasta Way
- 716 N Redding Way
- 775 N Shasta Way
- 773 N Quince Ave
- 703 N Redding Way
Your Personal Tour Guide
Ask me questions while you tour the home.