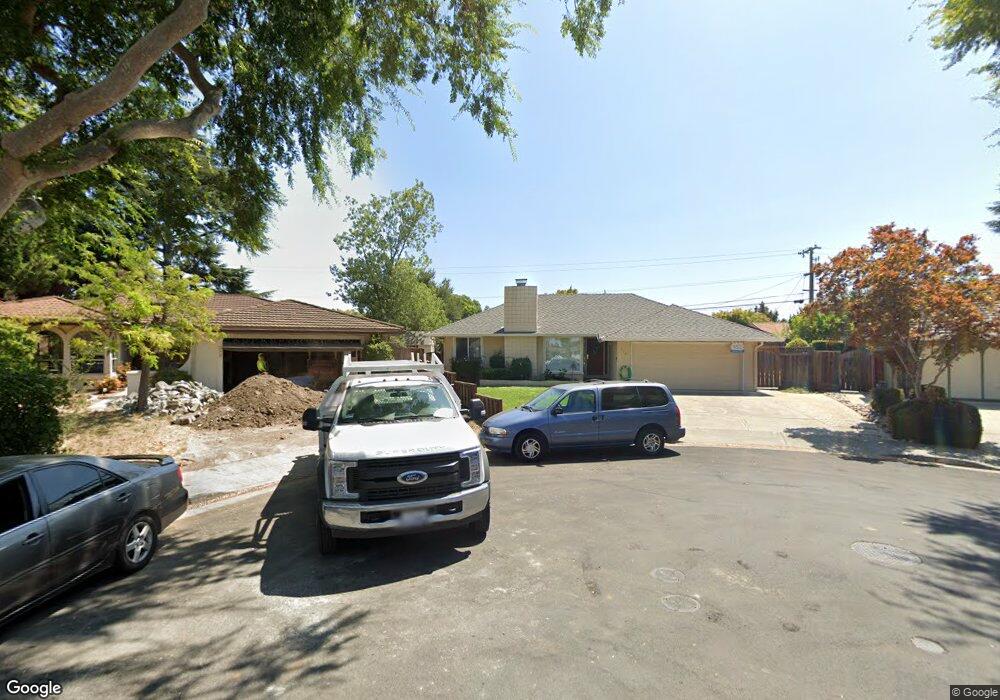
775 Palm Ct Sunnyvale, CA 94086
Ponderosa Park NeighborhoodEstimated Value: $2,523,000 - $2,779,672
3
Beds
2
Baths
1,727
Sq Ft
$1,566/Sq Ft
Est. Value
About This Home
This home is located at 775 Palm Ct, Sunnyvale, CA 94086 and is currently estimated at $2,703,918, approximately $1,565 per square foot. 775 Palm Ct is a home located in Santa Clara County with nearby schools including Ponderosa Elementary School, Marian A. Peterson Middle School, and Adrian Wilcox High School.
Ownership History
Date
Name
Owned For
Owner Type
Purchase Details
Closed on
Mar 8, 2022
Sold by
Yul Chung Jae
Bought by
Jae Yul Chung And Sunny Daesun Chung 2022 Rev and Chung Daesun Sunny
Current Estimated Value
Purchase Details
Closed on
Jan 24, 2014
Sold by
Chung Jae Yul
Bought by
Chung Jae Yul and Chung Dae Sun
Home Financials for this Owner
Home Financials are based on the most recent Mortgage that was taken out on this home.
Original Mortgage
$417,000
Interest Rate
4.45%
Mortgage Type
New Conventional
Purchase Details
Closed on
Mar 24, 2009
Sold by
Chung Dae Sun
Bought by
Chung Jae Yul
Purchase Details
Closed on
Apr 2, 1999
Sold by
Lott Richard D
Bought by
Chung Jae Yul and Chung Dae Sun
Home Financials for this Owner
Home Financials are based on the most recent Mortgage that was taken out on this home.
Original Mortgage
$350,000
Interest Rate
6.91%
Create a Home Valuation Report for This Property
The Home Valuation Report is an in-depth analysis detailing your home's value as well as a comparison with similar homes in the area
Home Values in the Area
Average Home Value in this Area
Purchase History
| Date | Buyer | Sale Price | Title Company |
|---|---|---|---|
| Jae Yul Chung And Sunny Daesun Chung 2022 Rev | -- | None Listed On Document | |
| Chung Jae Yul | -- | Orange Coast Title Company | |
| Chung Jae Yul | -- | None Available | |
| Chung Jae Yul | $525,000 | First American Title Guarant |
Source: Public Records
Mortgage History
| Date | Status | Borrower | Loan Amount |
|---|---|---|---|
| Previous Owner | Chung Jae Yul | $417,000 | |
| Previous Owner | Chung Jae Yul | $350,000 |
Source: Public Records
Tax History Compared to Growth
Tax History
| Year | Tax Paid | Tax Assessment Tax Assessment Total Assessment is a certain percentage of the fair market value that is determined by local assessors to be the total taxable value of land and additions on the property. | Land | Improvement |
|---|---|---|---|---|
| 2025 | $9,490 | $823,033 | $370,285 | $452,748 |
| 2024 | $9,490 | $806,896 | $363,025 | $443,871 |
| 2023 | $9,393 | $791,075 | $355,907 | $435,168 |
| 2022 | $9,237 | $775,565 | $348,929 | $426,636 |
| 2021 | $9,201 | $760,359 | $342,088 | $418,271 |
| 2020 | $9,034 | $752,564 | $338,581 | $413,983 |
| 2019 | $9,023 | $737,809 | $331,943 | $405,866 |
| 2018 | $8,444 | $723,343 | $325,435 | $397,908 |
| 2017 | $8,396 | $709,160 | $319,054 | $390,106 |
| 2016 | $8,223 | $695,256 | $312,799 | $382,457 |
| 2015 | $8,192 | $684,814 | $308,101 | $376,713 |
| 2014 | $7,723 | $671,400 | $302,066 | $369,334 |
Source: Public Records
Map
Nearby Homes
- 959 Reed Ave
- 474 Sequoia Dr
- 750 Calla Dr
- 248 Red Oak Dr E Unit A
- 863 Laburnum Dr
- 220 Red Oak Dr W Unit B
- 999 W Evelyn Terrace Unit 54
- 836 Mist Flower Terrace Unit 2
- 1038 Barberry Terrace
- 301 Stone Pine Terrace Unit 4
- 733 E Evelyn Ave
- 308 Stone Pine Terrace Unit 419
- 201 Stone Pine Terrace Unit 2
- 202 Stone Pine Terrace Unit 6
- 202 Stone Pine Terrace
- 202 Stone Pine Terrace Unit 2
- 146 Incense Terrace
- 1102 Althea Terrace Unit 1
- 107 Lemmon Terrace
- 1103 Reed Ave Unit A