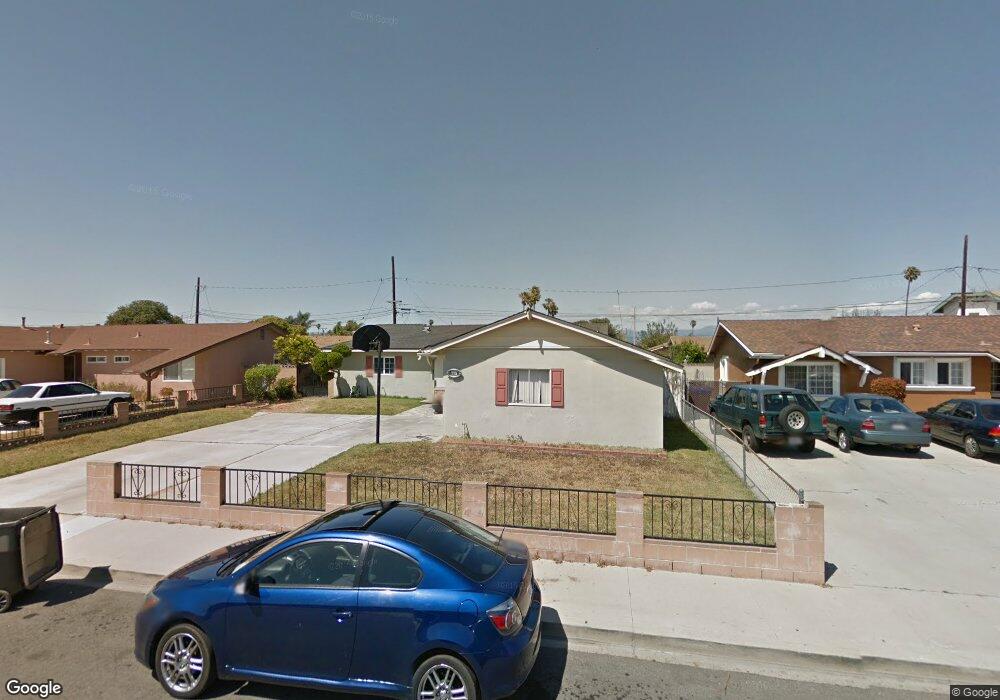
775 Polaris Way Port Hueneme, CA 93041
Estimated Value: $683,000 - $744,000
4
Beds
2
Baths
1,302
Sq Ft
$539/Sq Ft
Est. Value
About This Home
This home is located at 775 Polaris Way, Port Hueneme, CA 93041 and is currently estimated at $701,232, approximately $538 per square foot. 775 Polaris Way is a home located in Ventura County with nearby schools including Sunkist Elementary School, Hueneme High School, and St. Anthony's Elementary School.
Ownership History
Date
Name
Owned For
Owner Type
Purchase Details
Closed on
Apr 2, 2001
Sold by
Gutierrez Arturo and Gutierrez Ricardo
Bought by
Gutierrez Arturo and Gutierrez Maria T
Current Estimated Value
Home Financials for this Owner
Home Financials are based on the most recent Mortgage that was taken out on this home.
Original Mortgage
$133,066
Outstanding Balance
$48,907
Interest Rate
6.98%
Mortgage Type
FHA
Estimated Equity
$652,325
Purchase Details
Closed on
Feb 28, 1996
Sold by
Esparan Jose A
Bought by
Gutierrez Arturo and Gutierrez Ricardo
Purchase Details
Closed on
Jul 6, 1995
Sold by
Troutman Leonor N and Troutman Lenore
Bought by
Gutierrez Arturo and Gutierrez Ricardo
Home Financials for this Owner
Home Financials are based on the most recent Mortgage that was taken out on this home.
Original Mortgage
$137,761
Interest Rate
7.71%
Mortgage Type
FHA
Create a Home Valuation Report for This Property
The Home Valuation Report is an in-depth analysis detailing your home's value as well as a comparison with similar homes in the area
Home Values in the Area
Average Home Value in this Area
Purchase History
| Date | Buyer | Sale Price | Title Company |
|---|---|---|---|
| Gutierrez Arturo | $67,000 | Fidelity National Title | |
| Gutierrez Arturo | -- | -- | |
| Gutierrez Arturo | $140,000 | Commonwealth Land Title Co |
Source: Public Records
Mortgage History
| Date | Status | Borrower | Loan Amount |
|---|---|---|---|
| Open | Gutierrez Arturo | $133,066 | |
| Previous Owner | Gutierrez Arturo | $137,761 |
Source: Public Records
Tax History Compared to Growth
Tax History
| Year | Tax Paid | Tax Assessment Tax Assessment Total Assessment is a certain percentage of the fair market value that is determined by local assessors to be the total taxable value of land and additions on the property. | Land | Improvement |
|---|---|---|---|---|
| 2025 | $3,343 | $282,000 | $112,797 | $169,203 |
| 2024 | $3,343 | $276,471 | $110,585 | $165,886 |
| 2023 | $3,180 | $271,050 | $108,416 | $162,634 |
| 2022 | $3,091 | $265,736 | $106,290 | $159,446 |
| 2021 | $3,089 | $260,526 | $104,206 | $156,320 |
| 2020 | $3,052 | $257,857 | $103,139 | $154,718 |
| 2019 | $3,009 | $252,802 | $101,117 | $151,685 |
| 2018 | $2,911 | $247,846 | $99,135 | $148,711 |
| 2017 | $2,806 | $242,988 | $97,192 | $145,796 |
| 2016 | $2,724 | $238,225 | $95,287 | $142,938 |
| 2015 | $2,656 | $234,648 | $93,856 | $140,792 |
| 2014 | $2,629 | $230,053 | $92,018 | $138,035 |
Source: Public Records
Map
Nearby Homes
- 3511 S G St
- 4010 S J St
- 3100 Napa St
- 4105 S J St
- 1443 N 6th St
- 901 W Olive St
- 172 W Yucca St
- 145 Homer St
- 4029 S B St
- 0 Saviers Rd
- 2230 Lassen St
- 300 Ibsen Place Unit 132
- 1300 Friedrich Ln Unit B
- 1431 Casa San Carlos Ln
- 4811 S G St
- 360 Ibsen Place Unit 129
- 168 Lark St
- 912 Maplewood Way
- 234 Johnson Rd
- 445 Gaviota Place Unit 124
- 785 Polaris Way
- 765 Polaris Way
- 930 Portola Way
- 920 Portola Way
- 940 Portola Way
- 755 Polaris Way
- 776 Polaris Way
- 786 Polaris Way
- 910 Portola Way
- 766 Polaris Way
- 3508 Kern St
- 806 Polaris Way
- 756 Polaris Way
- 900 Portola Way
- 816 Polaris Way
- 825 Polaris Way
- 775 Thayer Ln
- 931 Portola Way
- 785 Thayer Ln
- 765 Thayer Ln