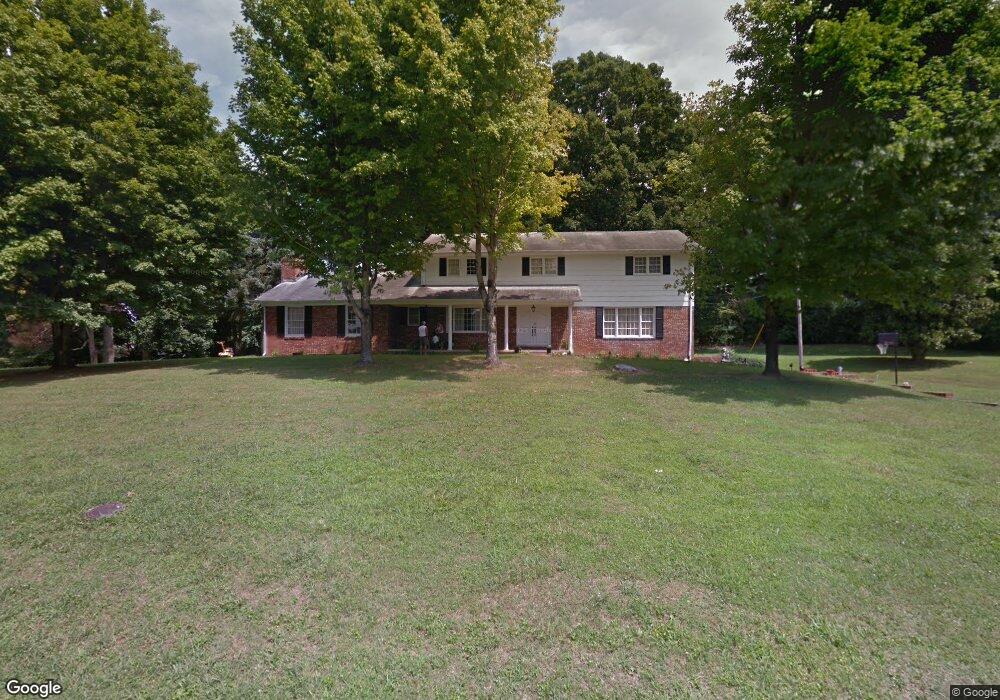
775 Spruce St Morristown, TN 37813
Estimated Value: $362,000 - $562,000
--
Bed
3
Baths
3,630
Sq Ft
$125/Sq Ft
Est. Value
About This Home
This home is located at 775 Spruce St, Morristown, TN 37813 and is currently estimated at $455,449, approximately $125 per square foot. 775 Spruce St is a home located in Hamblen County with nearby schools including Hillcrest Elementary School, Meadowview Middle School, and Morristown East High School.
Ownership History
Date
Name
Owned For
Owner Type
Purchase Details
Closed on
Jun 29, 2017
Sold by
Hunter Gregory and Hunter Sheila
Bought by
Sammons Chriatina S
Current Estimated Value
Home Financials for this Owner
Home Financials are based on the most recent Mortgage that was taken out on this home.
Original Mortgage
$165,000
Outstanding Balance
$137,574
Interest Rate
4.02%
Mortgage Type
New Conventional
Estimated Equity
$317,875
Purchase Details
Closed on
Mar 25, 2013
Sold by
Fuson J Lynn
Bought by
Hunter Gregory and Hunter Sheila
Home Financials for this Owner
Home Financials are based on the most recent Mortgage that was taken out on this home.
Original Mortgage
$130,000
Interest Rate
3.52%
Mortgage Type
Commercial
Purchase Details
Closed on
Mar 20, 1972
Bought by
Fuson Anne B
Create a Home Valuation Report for This Property
The Home Valuation Report is an in-depth analysis detailing your home's value as well as a comparison with similar homes in the area
Home Values in the Area
Average Home Value in this Area
Purchase History
| Date | Buyer | Sale Price | Title Company |
|---|---|---|---|
| Sammons Chriatina S | $206,251 | None Available | |
| Hunter Gregory | $145,000 | -- | |
| Fuson Anne B | -- | -- |
Source: Public Records
Mortgage History
| Date | Status | Borrower | Loan Amount |
|---|---|---|---|
| Open | Sammons Chriatina S | $165,000 | |
| Previous Owner | Hunter Gregory | $130,000 |
Source: Public Records
Tax History Compared to Growth
Tax History
| Year | Tax Paid | Tax Assessment Tax Assessment Total Assessment is a certain percentage of the fair market value that is determined by local assessors to be the total taxable value of land and additions on the property. | Land | Improvement |
|---|---|---|---|---|
| 2024 | $1,050 | $59,650 | $10,750 | $48,900 |
| 2023 | $1,050 | $59,650 | $0 | $0 |
| 2022 | $1,885 | $59,650 | $10,750 | $48,900 |
| 2021 | $1,885 | $59,650 | $10,750 | $48,900 |
| 2020 | $1,883 | $59,650 | $10,750 | $48,900 |
| 2019 | $2,024 | $59,525 | $13,525 | $46,000 |
| 2018 | $1,875 | $59,525 | $13,525 | $46,000 |
| 2017 | $1,845 | $59,525 | $13,525 | $46,000 |
| 2016 | $1,762 | $59,525 | $13,525 | $46,000 |
| 2015 | $1,639 | $59,525 | $13,525 | $46,000 |
| 2014 | -- | $59,525 | $13,525 | $46,000 |
| 2013 | -- | $65,625 | $0 | $0 |
Source: Public Records
Map
Nearby Homes
- 458 Laurel St
- 808 Gaston St
- 1670 Oak St
- 0 Russell Cir
- 460 Ash St
- 1205 Ledford Ave
- 1200 Liberty Hall Dr
- 1932 Eastern Ave
- 000 Bacon Ln
- 411 Ash St
- 216 Laurel St
- 518 W Hillcrest Dr
- 525 S Liberty Hill Rd
- 0 Joe Hall Rd Unit 703714
- 0 S Liberty Hill Rd Unit 703697
- 1710 Morningside Dr
- 915 Forgey Ave
- 819 Choctaw St
- 816 Choctaw St
- 712 Williams St
- 761 Spruce St
- 837 Spruce St
- 742 Pritchard Dr Unit S/D Arnold Hills
- 742 Pritchard Dr
- 800 Spruce St
- 770 Spruce St
- 746 Pritchard Dr
- 750 Pritchard Dr
- 755 Spruce St
- 842 Spruce St
- 736 Pritchard Dr
- 849 Spruce St
- 754 Spruce St
- 1844 Russell St
- 1848 Russell St
- 1840 Russell St
- 722 Pritchard Dr
- 751 Spruce St
- 735 Spruce St
- 858 Spruce St