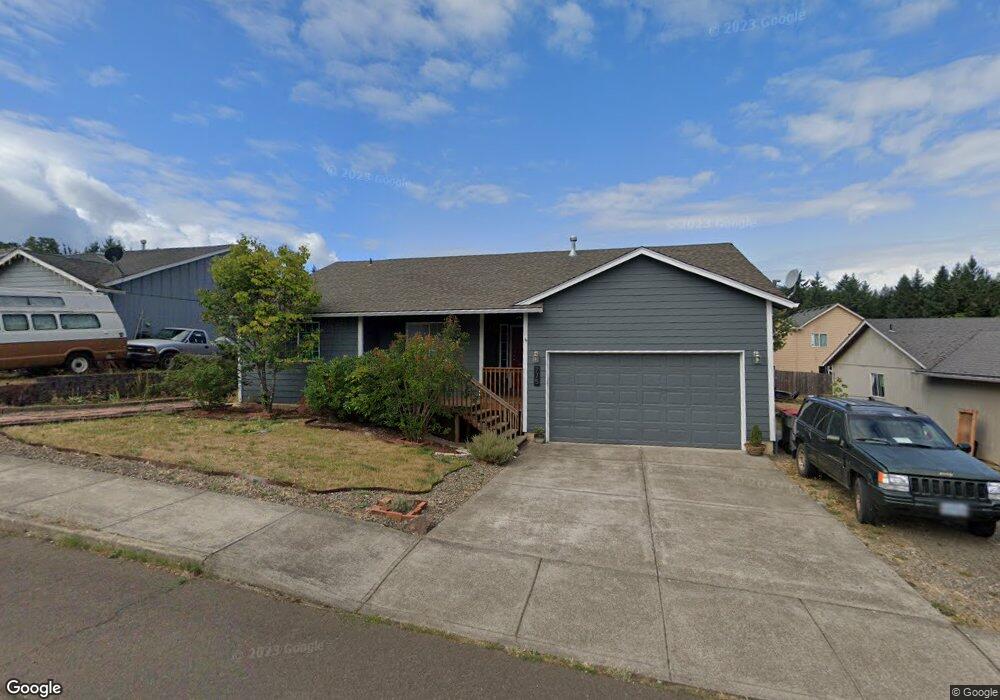
775 SW Bales Ave Willamina, OR 97396
Estimated Value: $339,000 - $344,000
3
Beds
2
Baths
1,466
Sq Ft
$233/Sq Ft
Est. Value
About This Home
This home is located at 775 SW Bales Ave, Willamina, OR 97396 and is currently estimated at $341,501, approximately $232 per square foot. 775 SW Bales Ave is a home located in Polk County with nearby schools including Willamina Elementary School, Willamina Middle School, and Willamina High School.
Ownership History
Date
Name
Owned For
Owner Type
Purchase Details
Closed on
Nov 20, 2014
Sold by
Speth Steve and Speth Gretchen
Bought by
Ott Casey David and Romero Ott Natividad
Current Estimated Value
Home Financials for this Owner
Home Financials are based on the most recent Mortgage that was taken out on this home.
Original Mortgage
$141,477
Outstanding Balance
$108,775
Interest Rate
4.1%
Mortgage Type
VA
Estimated Equity
$232,726
Purchase Details
Closed on
Apr 6, 2005
Sold by
Willcoxen Gary O and Willcoxen Cheryl K
Bought by
Speth Steve and Speth Gretchen
Home Financials for this Owner
Home Financials are based on the most recent Mortgage that was taken out on this home.
Original Mortgage
$109,200
Interest Rate
5.92%
Mortgage Type
Purchase Money Mortgage
Purchase Details
Closed on
Oct 27, 2004
Sold by
Willcoxen Gary O
Bought by
Willcoxen Gary O and Willcoxen Cheryl K
Home Financials for this Owner
Home Financials are based on the most recent Mortgage that was taken out on this home.
Original Mortgage
$104,000
Interest Rate
4.27%
Mortgage Type
New Conventional
Purchase Details
Closed on
Aug 25, 2004
Sold by
Tran Co
Bought by
Willcoxen Gary O
Create a Home Valuation Report for This Property
The Home Valuation Report is an in-depth analysis detailing your home's value as well as a comparison with similar homes in the area
Home Values in the Area
Average Home Value in this Area
Purchase History
| Date | Buyer | Sale Price | Title Company |
|---|---|---|---|
| Ott Casey David | $138,500 | Ticor Title Co | |
| Speth Steve | $136,500 | Fidelity Natl Title Co Of Or | |
| Willcoxen Gary O | -- | Amerititle | |
| Willcoxen Gary O | $27,841 | Amerititle |
Source: Public Records
Mortgage History
| Date | Status | Borrower | Loan Amount |
|---|---|---|---|
| Open | Ott Casey David | $141,477 | |
| Previous Owner | Speth Steve | $109,200 | |
| Previous Owner | Willcoxen Gary O | $104,000 |
Source: Public Records
Tax History Compared to Growth
Tax History
| Year | Tax Paid | Tax Assessment Tax Assessment Total Assessment is a certain percentage of the fair market value that is determined by local assessors to be the total taxable value of land and additions on the property. | Land | Improvement |
|---|---|---|---|---|
| 2025 | $2,777 | $180,110 | $48,550 | $131,560 |
| 2024 | $2,777 | $174,870 | $47,130 | $127,740 |
| 2023 | $2,594 | $169,780 | $45,760 | $124,020 |
| 2022 | $2,507 | $164,840 | $44,430 | $120,410 |
| 2021 | $2,441 | $160,040 | $43,130 | $116,910 |
| 2020 | $2,363 | $155,380 | $41,870 | $113,510 |
| 2019 | $2,141 | $150,860 | $40,650 | $110,210 |
| 2018 | $2,113 | $146,470 | $39,470 | $107,000 |
| 2017 | $2,018 | $142,210 | $38,320 | $103,890 |
| 2016 | $1,982 | $138,070 | $37,200 | $100,870 |
| 2015 | $1,948 | $134,050 | $36,120 | $97,930 |
| 2014 | $1,881 | $130,150 | $35,070 | $95,080 |
Source: Public Records
Map
Nearby Homes
- 750 SW Pioneer Ct
- 790 SW Pioneer Ct
- 780 SW Hill Dr
- 1532 SW Pioneer Dr
- 321 SW James St
- 350 NW Willamina Dr
- 140 SE Lamson St
- 315 NW Pacific Hills Dr
- 327 NW Pacific Hills Dr
- 541 NW Churchman
- 413 NW Pacific Hills Dr
- 175 NW 3rd St
- 323 NW Pacific Hills Dr
- 321 NW Pacific Hills Dr
- 320 NW Pacific Hills Dr
- 182 NE 5th St
- 368 NE Yamhill St
- 1027 Highlands Loop
- 453 NE Yamhill St
- 0 NE 5th St
- 745 SW Bales Ave
- 805 SW Bales Ave
- 780 Conastoga (-890) St
- 780 SW Conastoga (-790) St
- 780 SW Conastoga St
- 790 SW Conastoga St
- 760 SW Conastoga St
- 810 SW Conastoga St
- 845 S West Bales Ave
- 740 SW Conastoga St
- 845 SW Bales Ave
- 810 S West Bales Ave
- 1045 SW Pioneer Dr
- 1051 SW Pioneer Dr
- 1053 SW Pioneer Dr
- 880 SW Bales Ave
- 840 SW Conastoga St
- 780 SW Bales Ave
- 1035 SW Pioneer Dr
- 810 SW Bales Ave