Estimated Value: $417,732 - $475,000
2
Beds
2
Baths
1,400
Sq Ft
$320/Sq Ft
Est. Value
About This Home
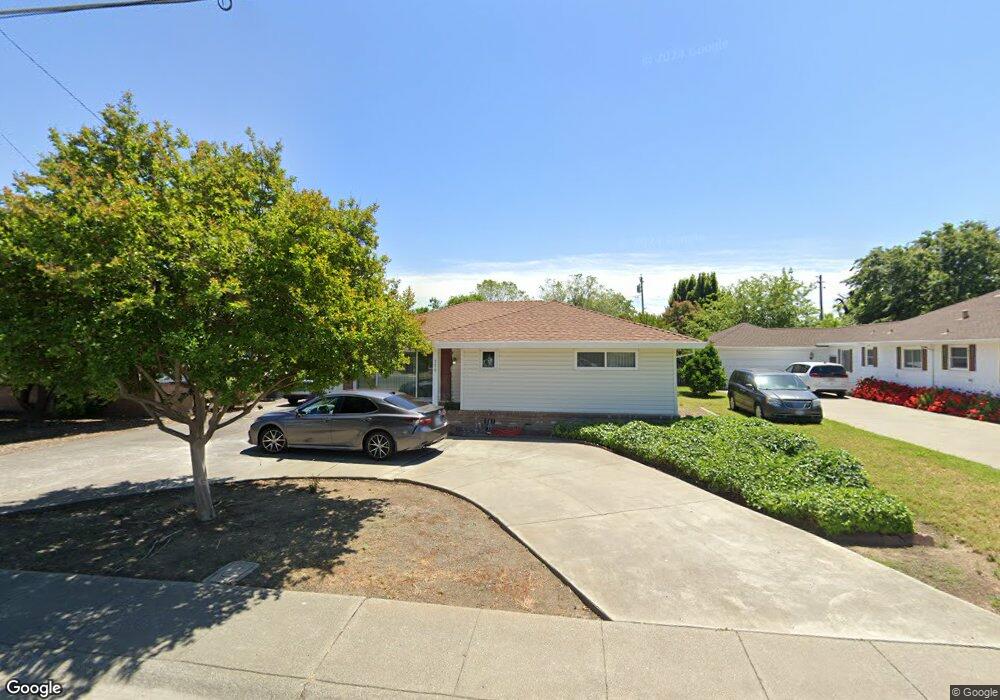
This home is located at 775 W A St, Dixon, CA 95620 and is currently estimated at $447,433, approximately $319 per square foot. 775 W A St is a home located in Solano County with nearby schools including Anderson (Linford L.) Elementary School, Dixon High School, and Dixon Montessori Charter.
Ownership History
Date
Name
Owned For
Owner Type
Purchase Details
Closed on
Sep 19, 2012
Sold by
Baker Richard L and Baker Karen L
Bought by
Baker Richard L and Baker Karen L
Current Estimated Value
Home Financials for this Owner
Home Financials are based on the most recent Mortgage that was taken out on this home.
Original Mortgage
$223,000
Outstanding Balance
$154,452
Interest Rate
3.59%
Mortgage Type
New Conventional
Estimated Equity
$292,981
Purchase Details
Closed on
Oct 22, 1997
Sold by
Carlene Baker and Carlene Otis M
Bought by
Baker Richard L and Baker Karen L
Create a Home Valuation Report for This Property
The Home Valuation Report is an in-depth analysis detailing your home's value as well as a comparison with similar homes in the area
Home Values in the Area
Average Home Value in this Area
Purchase History
We collect this data history from publicly available records. To have your information removed, we recommend requesting removal directly through your county’s website.
| Date | Buyer | Sale Price | Title Company |
|---|---|---|---|
| Baker Richard L | -- | First American Title | |
| Baker Richard L | -- | -- |
Source: Public Records
Mortgage History
We collect this data history from publicly available records. To have your information removed, we recommend requesting removal directly through your county’s website.
| Date | Status | Borrower | Loan Amount |
|---|---|---|---|
| Open | Baker Richard L | $223,000 |
Source: Public Records
Tax History
| Year | Tax Paid | Tax Assessment Tax Assessment Total Assessment is a certain percentage of the fair market value that is determined by local assessors to be the total taxable value of land and additions on the property. | Land | Improvement |
|---|---|---|---|---|
| 2025 | $2,307 | $207,573 | $71,853 | $135,720 |
| 2024 | $2,307 | $203,504 | $70,445 | $133,059 |
| 2023 | $2,239 | $199,514 | $69,064 | $130,450 |
| 2022 | $2,207 | $195,603 | $67,710 | $127,893 |
| 2021 | $2,180 | $191,769 | $66,383 | $125,386 |
| 2020 | $2,145 | $189,804 | $65,703 | $124,101 |
| 2019 | $2,105 | $186,083 | $64,415 | $121,668 |
| 2018 | $2,097 | $182,435 | $63,152 | $119,283 |
| 2017 | $2,045 | $178,859 | $61,914 | $116,945 |
| 2016 | $1,950 | $175,352 | $60,700 | $114,652 |
| 2015 | $1,905 | $172,719 | $59,789 | $112,930 |
| 2014 | $1,886 | $169,336 | $58,618 | $110,718 |
Source: Public Records
Map
Nearby Homes
- 580 W B St
- 875 Sievers Way
- 315 S Almond St
- 255 Diane Place
- 625 Cypress St
- 610 Sierra Dr
- 1250 Redwood Ct
- 241 S 1st St
- 730 Park Dr
- 970 Camelia Dr
- 10 Solano Dr
- 535 Amesbury Dr
- 1365 Jacobs Place
- 580 Wildflower Ct
- 220 Foster Ln
- 1535 Arlington Ct
- 1130 Legion Ct
- 660 Berkshire Dr
- 1445 Goldfield Ln
- 995 Mason Ct
Your Personal Tour Guide
Ask me questions while you tour the home.