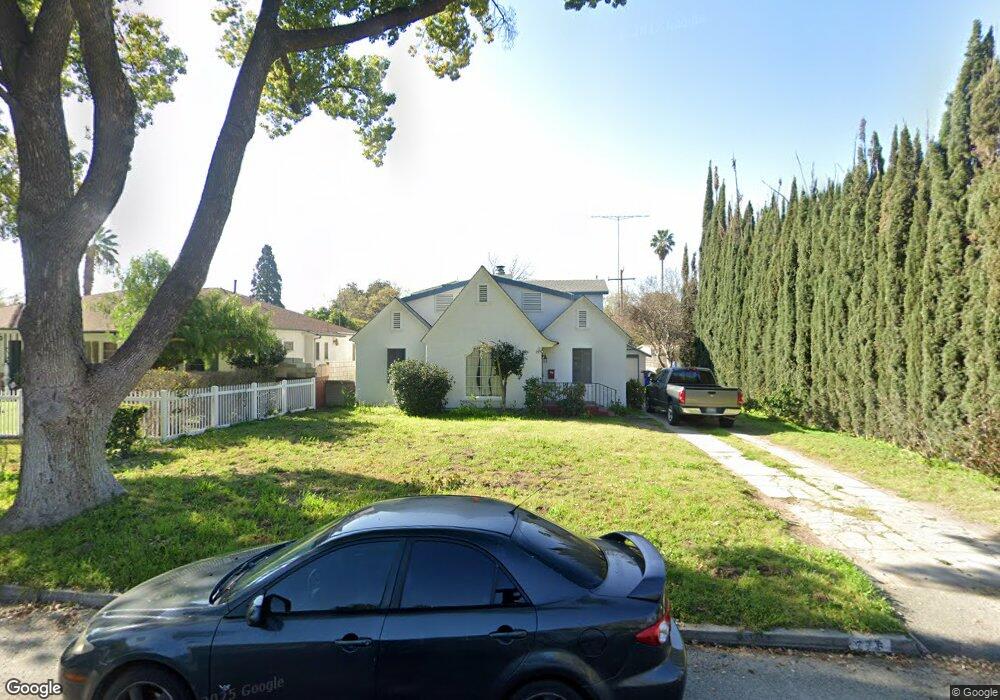
775 W Marshall Blvd San Bernardino, CA 92405
Shandin Hills NeighborhoodEstimated Value: $487,525 - $581,000
5
Beds
3
Baths
1,670
Sq Ft
$327/Sq Ft
Est. Value
About This Home
This home is located at 775 W Marshall Blvd, San Bernardino, CA 92405 and is currently estimated at $545,631, approximately $326 per square foot. 775 W Marshall Blvd is a home located in San Bernardino County with nearby schools including Marshall Elementary School, Golden Valley Middle School, and San Bernardino High School.
Ownership History
Date
Name
Owned For
Owner Type
Purchase Details
Closed on
Apr 21, 2023
Sold by
Thomas John Owen Norman and Thomas Nancy Anne
Bought by
Nn6 Llc
Current Estimated Value
Purchase Details
Closed on
Nov 27, 2020
Sold by
Harter Joseph L and Harter Susan M
Bought by
Daggett Land Holdings2 Llc
Purchase Details
Closed on
Jan 10, 2003
Sold by
Thomas John Norman and Thomas Nancy A
Bought by
Thomas John Norman and Thomas Nancy A
Home Financials for this Owner
Home Financials are based on the most recent Mortgage that was taken out on this home.
Original Mortgage
$80,000
Interest Rate
5.96%
Purchase Details
Closed on
Jan 3, 2003
Sold by
Va
Bought by
Thomas J O Norman and Thomas Nancy A
Home Financials for this Owner
Home Financials are based on the most recent Mortgage that was taken out on this home.
Original Mortgage
$80,000
Interest Rate
5.96%
Create a Home Valuation Report for This Property
The Home Valuation Report is an in-depth analysis detailing your home's value as well as a comparison with similar homes in the area
Home Values in the Area
Average Home Value in this Area
Purchase History
| Date | Buyer | Sale Price | Title Company |
|---|---|---|---|
| Nn6 Llc | -- | None Listed On Document | |
| Daggett Land Holdings2 Llc | $3,478,500 | Stewart Title Guaranty Co | |
| Thomas John Norman | -- | American Title | |
| Thomas J O Norman | -- | American Title |
Source: Public Records
Mortgage History
| Date | Status | Borrower | Loan Amount |
|---|---|---|---|
| Previous Owner | Thomas John Norman | $80,000 |
Source: Public Records
Tax History Compared to Growth
Tax History
| Year | Tax Paid | Tax Assessment Tax Assessment Total Assessment is a certain percentage of the fair market value that is determined by local assessors to be the total taxable value of land and additions on the property. | Land | Improvement |
|---|---|---|---|---|
| 2025 | $1,671 | $122,406 | $22,203 | $100,203 |
| 2024 | $1,671 | $120,006 | $21,768 | $98,238 |
| 2023 | $1,629 | $117,653 | $21,341 | $96,312 |
| 2022 | $1,629 | $115,347 | $20,923 | $94,424 |
| 2021 | $1,629 | $113,086 | $20,513 | $92,573 |
| 2020 | $1,630 | $111,927 | $20,303 | $91,624 |
| 2019 | $1,585 | $109,732 | $19,905 | $89,827 |
| 2018 | $1,568 | $107,581 | $19,515 | $88,066 |
| 2017 | $1,520 | $105,471 | $19,132 | $86,339 |
| 2016 | $1,475 | $103,403 | $18,757 | $84,646 |
| 2015 | $1,351 | $101,850 | $18,475 | $83,375 |
| 2014 | $1,314 | $99,855 | $18,113 | $81,742 |
Source: Public Records
Map
Nearby Homes
- 783 W Marshall Blvd
- 767 W Marshall Blvd
- 3166 N Crescent Ave
- 791 W Marshall Blvd
- 3171 N H St
- 3156 N Crescent Ave
- 3161 N H St
- 751 W Marshall Blvd
- 3146 N Crescent Ave
- 3151 N H St
- 809 W Marshall Blvd
- 774 W Marshall Blvd
- 743 W Marshall Blvd
- 766 W Marshall Blvd
- 3138 N Crescent Ave
- 760 W Marshall Blvd
- 3165 N Crescent Ave
- 3137 N H St
- 3156 N H St
- 3155 N Crescent Ave