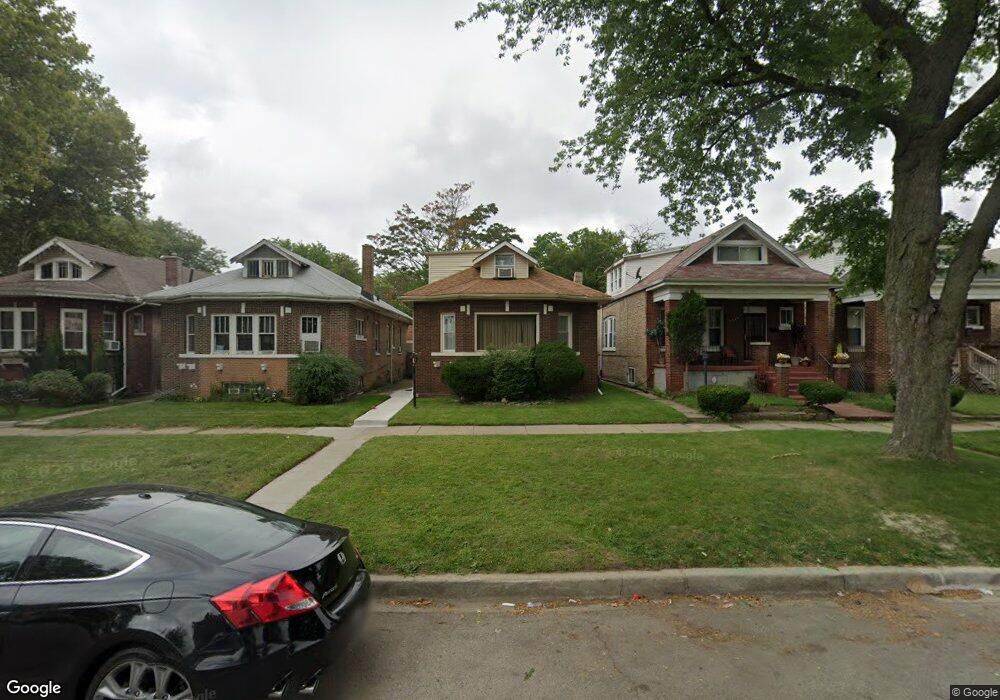
7750 S Calumet Ave Chicago, IL 60619
Park Manor NeighborhoodEstimated Value: $235,000 - $276,000
5
Beds
2
Baths
1,288
Sq Ft
$197/Sq Ft
Est. Value
About This Home
This home is located at 7750 S Calumet Ave, Chicago, IL 60619 and is currently estimated at $254,110, approximately $197 per square foot. 7750 S Calumet Ave is a home located in Cook County with nearby schools including Ruggles Elementary School, Betty Shabazz Academy, and Rescue Missionary Christian School.
Ownership History
Date
Name
Owned For
Owner Type
Purchase Details
Closed on
Mar 23, 2001
Sold by
Va
Bought by
Smith Ebony M
Current Estimated Value
Home Financials for this Owner
Home Financials are based on the most recent Mortgage that was taken out on this home.
Original Mortgage
$89,203
Outstanding Balance
$32,481
Interest Rate
7.02%
Mortgage Type
FHA
Estimated Equity
$221,629
Purchase Details
Closed on
Jul 25, 2000
Sold by
Hartford
Bought by
Va
Purchase Details
Closed on
Jan 3, 1999
Sold by
Hartford Henry
Bought by
Hartford Patricia
Purchase Details
Closed on
Mar 7, 1995
Sold by
Heritage Trust Company
Bought by
Hartford Henry E
Home Financials for this Owner
Home Financials are based on the most recent Mortgage that was taken out on this home.
Original Mortgage
$102,000
Interest Rate
9.13%
Mortgage Type
Assumption
Purchase Details
Closed on
Nov 21, 1994
Sold by
T Development Two Inc
Bought by
Heritage Trust Company
Purchase Details
Closed on
Oct 21, 1994
Sold by
Sheppard William E and Sheppard Louise
Bought by
T Development Two Inc
Create a Home Valuation Report for This Property
The Home Valuation Report is an in-depth analysis detailing your home's value as well as a comparison with similar homes in the area
Home Values in the Area
Average Home Value in this Area
Purchase History
| Date | Buyer | Sale Price | Title Company |
|---|---|---|---|
| Smith Ebony M | -- | -- | |
| Va | -- | -- | |
| Hartford Patricia | -- | -- | |
| Hartford Henry E | $100,000 | -- | |
| Heritage Trust Company | $38,000 | -- | |
| T Development Two Inc | $20,000 | -- |
Source: Public Records
Mortgage History
| Date | Status | Borrower | Loan Amount |
|---|---|---|---|
| Open | Smith Ebony M | $89,203 | |
| Previous Owner | Hartford Henry E | $102,000 |
Source: Public Records
Tax History Compared to Growth
Tax History
| Year | Tax Paid | Tax Assessment Tax Assessment Total Assessment is a certain percentage of the fair market value that is determined by local assessors to be the total taxable value of land and additions on the property. | Land | Improvement |
|---|---|---|---|---|
| 2024 | $3,309 | $13,300 | $3,985 | $9,315 |
| 2023 | $3,204 | $19,000 | $5,313 | $13,687 |
| 2022 | $3,204 | $19,000 | $5,313 | $13,687 |
| 2021 | $3,151 | $19,000 | $5,313 | $13,687 |
| 2020 | $2,127 | $12,650 | $4,250 | $8,400 |
| 2019 | $2,104 | $13,902 | $4,250 | $9,652 |
| 2018 | $2,067 | $13,902 | $4,250 | $9,652 |
| 2017 | $2,355 | $14,314 | $3,719 | $10,595 |
| 2016 | $2,367 | $14,314 | $3,719 | $10,595 |
| 2015 | $2,142 | $14,314 | $3,719 | $10,595 |
| 2014 | $1,931 | $12,974 | $3,187 | $9,787 |
| 2013 | $1,881 | $12,974 | $3,187 | $9,787 |
Source: Public Records
Map
Nearby Homes
- 7720 S Prairie Ave
- 7741 S Indiana Ave
- 7627 S Prairie Ave
- 7808 S Vernon Ave
- 7736 S Indiana Ave
- 7616 S Calumet Ave
- 7918 S Calumet Ave
- 7832 S Eberhart Ave
- 7635 S Michigan Ave
- 7801 S Eberhart Ave
- 7817 S Eberhart Ave
- 7744 S Rhodes Ave
- 7811 S Wabash Ave
- 7950 S Indiana Ave
- 7817 S Rhodes Ave
- 7535 S Vernon Ave
- 7619 S Wabash Ave
- 7708 S Wabash Ave
- 7658 S Wabash Ave
- 7646 S Wabash Ave
- 7748 S Calumet Ave
- 7754 S Calumet Ave
- 7744 S Calumet Ave
- 7758 S Calumet Ave
- 7742 S Calumet Ave
- 7740 S Calumet Ave
- 7736 S Calumet Ave
- 7734 S Calumet Ave
- 7753 S Prairie Ave
- 7751 S Prairie Ave
- 7747 S Prairie Ave
- 7757 S Prairie Ave
- 7745 S Prairie Ave
- 7732 S Calumet Ave
- 7741 S Prairie Ave
- 7739 S Prairie Ave
- 7728 S Calumet Ave
- 7735 S Prairie Ave
- 7726 S Calumet Ave
- 7753 S Calumet Ave