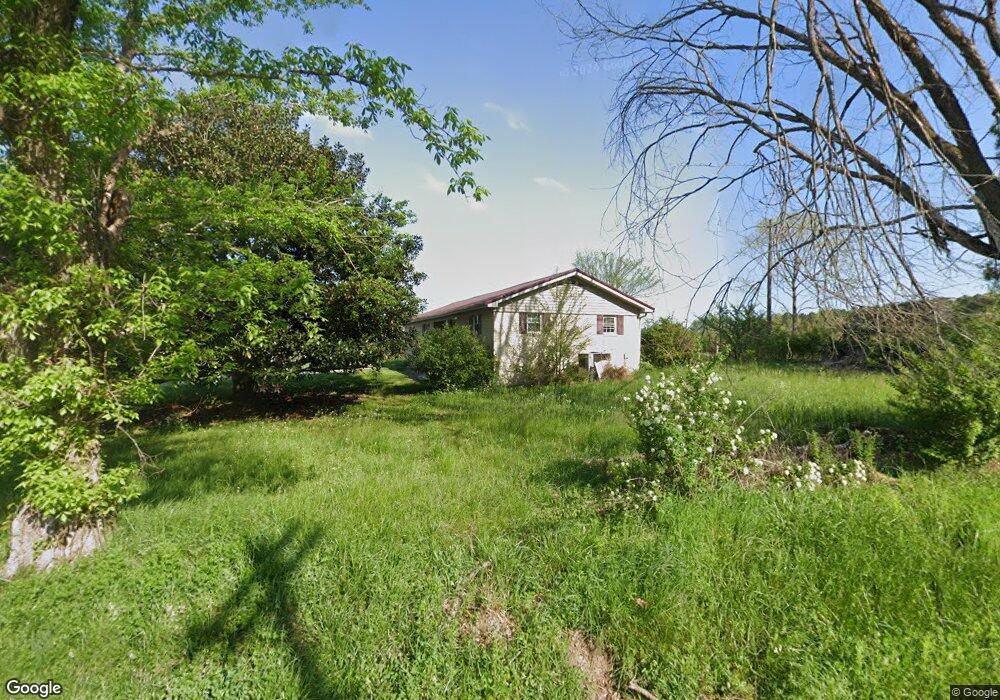
7750 Terry Rd Cedar Grove, TN 38321
Estimated Value: $154,000 - $208,000
--
Bed
1
Bath
1,621
Sq Ft
$107/Sq Ft
Est. Value
About This Home
This home is located at 7750 Terry Rd, Cedar Grove, TN 38321 and is currently estimated at $173,769, approximately $107 per square foot. 7750 Terry Rd is a home located in Carroll County with nearby schools including West Carroll Primary School, West Carroll Elementary School, and West Carroll Junior/Senior High School.
Ownership History
Date
Name
Owned For
Owner Type
Purchase Details
Closed on
Feb 26, 2019
Sold by
Seay Dustin
Bought by
Ridgely Darrell
Current Estimated Value
Purchase Details
Closed on
Jul 10, 2018
Sold by
Seay Amanda
Bought by
Seay Dustin
Purchase Details
Closed on
Nov 2, 2017
Sold by
Orseske Catherine L
Bought by
Seay Dustin and Seay Amanda
Purchase Details
Closed on
Feb 27, 2015
Sold by
Woodcock Christina Griggs
Bought by
Seay Dustin and Seay Amanda
Purchase Details
Closed on
Mar 16, 2010
Sold by
Seay Janet Ann
Bought by
Seay Dustin
Purchase Details
Closed on
Feb 7, 2006
Sold by
Parish Donald E
Bought by
Seay Jerry
Purchase Details
Closed on
Aug 20, 1996
Sold by
Seay Willie Joe
Bought by
Loflin Ollie L
Purchase Details
Closed on
Apr 1, 1988
Bought by
Seay Willie Joe and Seay Addellery
Purchase Details
Closed on
Oct 10, 1986
Purchase Details
Closed on
Feb 7, 1974
Purchase Details
Closed on
Nov 24, 1972
Create a Home Valuation Report for This Property
The Home Valuation Report is an in-depth analysis detailing your home's value as well as a comparison with similar homes in the area
Home Values in the Area
Average Home Value in this Area
Purchase History
| Date | Buyer | Sale Price | Title Company |
|---|---|---|---|
| Ridgely Darrell | $92,500 | -- | |
| Seay Dustin | -- | -- | |
| Seay Dustin | $8,000 | -- | |
| Seay Dustin | -- | -- | |
| Seay Dustin | -- | -- | |
| Seay Jerry | -- | -- | |
| Loflin Ollie L | -- | -- | |
| Seay Willie Joe | -- | -- | |
| -- | -- | -- | |
| -- | -- | -- | |
| -- | -- | -- |
Source: Public Records
Tax History Compared to Growth
Tax History
| Year | Tax Paid | Tax Assessment Tax Assessment Total Assessment is a certain percentage of the fair market value that is determined by local assessors to be the total taxable value of land and additions on the property. | Land | Improvement |
|---|---|---|---|---|
| 2024 | $597 | $22,675 | $4,300 | $18,375 |
| 2023 | $597 | $22,675 | $4,300 | $18,375 |
| 2022 | $597 | $22,675 | $4,300 | $18,375 |
| 2021 | $320 | $22,675 | $4,300 | $18,375 |
| 2020 | $597 | $22,675 | $4,300 | $18,375 |
| 2019 | $712 | $24,550 | $9,750 | $14,800 |
| 2018 | $617 | $21,950 | $7,150 | $14,800 |
| 2017 | $617 | $21,250 | $6,450 | $14,800 |
| 2016 | $904 | $21,250 | $6,450 | $14,800 |
| 2015 | $637 | $21,250 | $6,450 | $14,800 |
| 2014 | $633 | $21,250 | $6,450 | $14,800 |
| 2013 | $633 | $20,498 | $0 | $0 |
Source: Public Records
Map
Nearby Homes
- 85 Burns Ln
- 9173 Tennessee 104
- 000 Little Grove Rd
- 5259 Highway 104 W
- 670 Jones Ln
- 455 Holder Rd
- 80 Water Tower Rd
- 9115 Highway 70 E
- 9100 Highway 70 E
- 392 Howley Ln
- 290 Leeford Ln
- 398 War Eagle Dr
- 240 War Eagle Dr
- 80 Torpedo Ct
- 10533 Highway 70 E
- 10533 Highway 70
- 313 Logger Ln
- 334 Logger Ln
- 328 Bigysmal Ln
- 454 Logger Ln