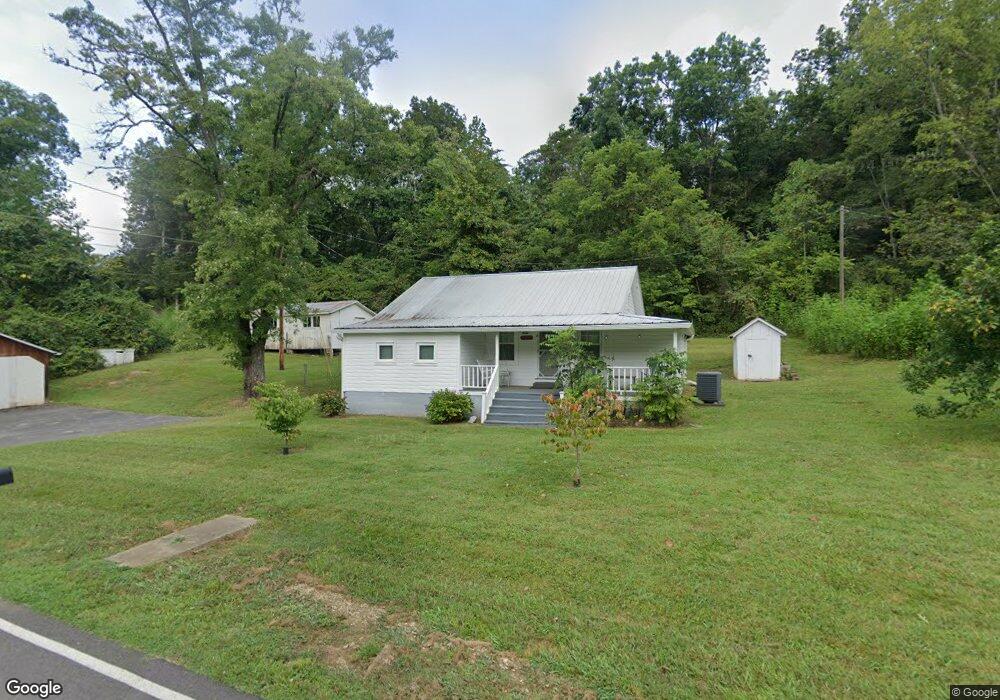
7751 Cedar Creek Rd Townsend, TN 37882
Estimated Value: $299,659 - $356,000
--
Bed
1
Bath
1,067
Sq Ft
$309/Sq Ft
Est. Value
About This Home
This home is located at 7751 Cedar Creek Rd, Townsend, TN 37882 and is currently estimated at $329,665, approximately $308 per square foot. 7751 Cedar Creek Rd is a home located in Blount County with nearby schools including Townsend Elementary School, Heritage Middle School, and Heritage High School.
Ownership History
Date
Name
Owned For
Owner Type
Purchase Details
Closed on
Aug 31, 2005
Sold by
Vernard Tim D
Bought by
Boyd Ronald
Current Estimated Value
Home Financials for this Owner
Home Financials are based on the most recent Mortgage that was taken out on this home.
Original Mortgage
$111,200
Outstanding Balance
$58,968
Interest Rate
5.71%
Estimated Equity
$270,697
Purchase Details
Closed on
Jan 4, 2002
Sold by
Knapp Wesley
Bought by
Venard Timothy
Home Financials for this Owner
Home Financials are based on the most recent Mortgage that was taken out on this home.
Original Mortgage
$116,100
Interest Rate
6.99%
Purchase Details
Closed on
Feb 6, 2001
Sold by
Ledbetter Maynard
Bought by
Knapp Wesley
Purchase Details
Closed on
Jan 18, 2001
Sold by
Ledbetter Maynard
Bought by
John Polk
Purchase Details
Closed on
Feb 27, 1998
Sold by
Ledbetter Maynard
Bought by
Palewski Ronald
Purchase Details
Closed on
Sep 25, 1938
Bought by
Ledbetter Maynard
Create a Home Valuation Report for This Property
The Home Valuation Report is an in-depth analysis detailing your home's value as well as a comparison with similar homes in the area
Home Values in the Area
Average Home Value in this Area
Purchase History
| Date | Buyer | Sale Price | Title Company |
|---|---|---|---|
| Boyd Ronald | $139,000 | -- | |
| Venard Timothy | $129,000 | -- | |
| Knapp Wesley | $65,000 | -- | |
| John Polk | $85,000 | -- | |
| Palewski Ronald | $27,500 | -- | |
| Ledbetter Maynard | -- | -- |
Source: Public Records
Mortgage History
| Date | Status | Borrower | Loan Amount |
|---|---|---|---|
| Open | Ledbetter Maynard | $111,200 | |
| Previous Owner | Ledbetter Maynard | $116,100 |
Source: Public Records
Tax History Compared to Growth
Tax History
| Year | Tax Paid | Tax Assessment Tax Assessment Total Assessment is a certain percentage of the fair market value that is determined by local assessors to be the total taxable value of land and additions on the property. | Land | Improvement |
|---|---|---|---|---|
| 2024 | $962 | $60,500 | $11,875 | $48,625 |
| 2023 | $962 | $60,500 | $11,875 | $48,625 |
| 2022 | $877 | $35,525 | $8,800 | $26,725 |
| 2021 | $877 | $35,525 | $8,800 | $26,725 |
| 2020 | $877 | $35,525 | $8,800 | $26,725 |
| 2019 | $877 | $35,525 | $8,800 | $26,725 |
| 2018 | $879 | $35,600 | $9,700 | $25,900 |
| 2017 | $879 | $35,600 | $9,700 | $25,900 |
| 2016 | $879 | $35,600 | $9,700 | $25,900 |
| 2015 | $765 | $35,600 | $9,700 | $25,900 |
| 2014 | $777 | $35,600 | $9,700 | $25,900 |
| 2013 | $777 | $36,125 | $0 | $0 |
Source: Public Records
Map
Nearby Homes
- 358 Webb Rd
- 7915 Carnes Rd
- G2 & G3 Carnes Rd
- 224 Webb Rd
- 7641 Powderhorn Trail
- 0 E Lamar Alexander Pkwy Unit 1301803
- 8023 W Old Highway 73 Unit 102
- 0 Bethel Church Rd Unit 308641
- 0 Bethel Church Rd Unit 1317497
- 311 E Chestnut Hill Rd
- 7539 W Old Highway 73
- 8017 E Lamar Alexander Pkwy
- 21 Tennessee 73
- 1011 Carrs Creek Rd
- 311 Domar Dr
- 0 Shooting Star Loop
- 326 Shooting Star Loop Unit 101
- 326 Shooting Star Loop Unit 203
- 326 Shooting Star Loop Unit 202
- 326 Shooting Star Loop Unit 201
- Lot 4 Cedar Creek Rd
- 7754 Cedar Creek Rd
- 7762 Cedar Creek Rd
- 7743 Cedar Creek Rd
- 7728 Cedar Creek Rd
- 7746 Caylors Chapel Rd
- 7764 Cedar Creek Rd
- 7760 Cedar Creek Rd
- 7777 Cedar Creek Rd
- 7793 Cedar Creek Rd Unit 7795
- 7715 Cedar Creek Rd
- 7778 Cedar Creek Rd
- 7720 Cedar Creek Rd
- 7790 Berry Williams Rd
- 7726 Caylors Chapel Rd
- 7755 Berry Williams Rd
- 7710 Cedar Creek Rd
- 7801 Berry Williams Rd
- 7801 Berry Williams Rd
- 7810 Berry Williams Rd