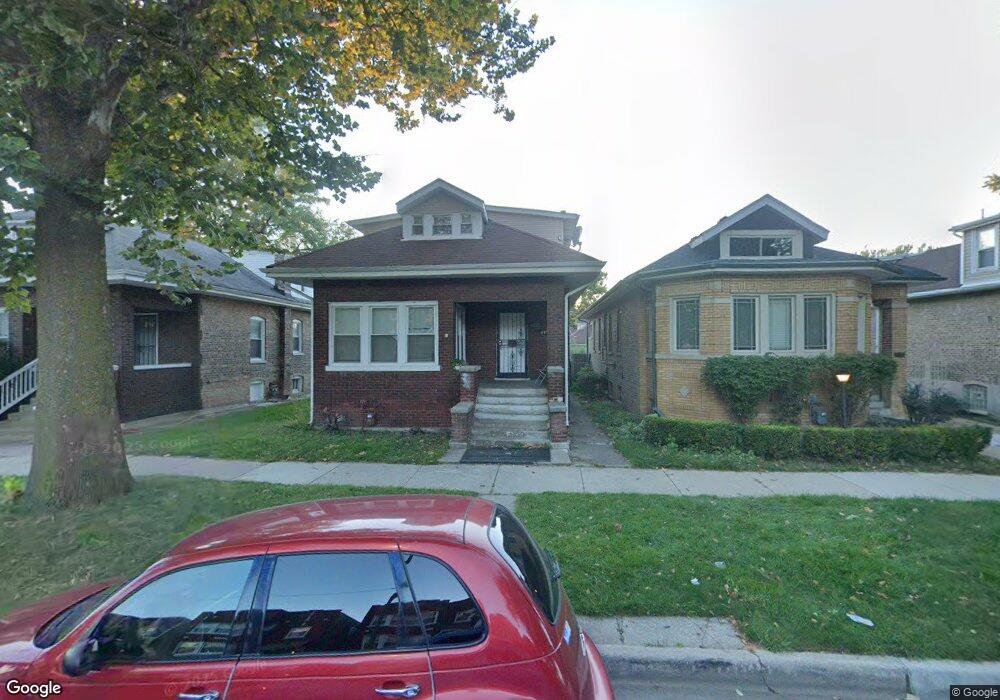
7752 S Clyde Ave Chicago, IL 60649
South Shore NeighborhoodEstimated Value: $178,000 - $270,000
4
Beds
3
Baths
2,040
Sq Ft
$111/Sq Ft
Est. Value
About This Home
This home is located at 7752 S Clyde Ave, Chicago, IL 60649 and is currently estimated at $226,366, approximately $110 per square foot. 7752 S Clyde Ave is a home located in Cook County with nearby schools including Mann Elementary School, Muhammad University, and St Paul Lutheran School.
Ownership History
Date
Name
Owned For
Owner Type
Purchase Details
Closed on
Aug 11, 2021
Sold by
Astor Property Management Corporation
Bought by
Chicago Residential Properties Llc
Current Estimated Value
Purchase Details
Closed on
Dec 21, 2006
Sold by
Astor Properties Group Llc
Bought by
Clyde #7752 Land Trust and Astor Property Management Corp
Home Financials for this Owner
Home Financials are based on the most recent Mortgage that was taken out on this home.
Original Mortgage
$200,000
Interest Rate
7.5%
Mortgage Type
Unknown
Purchase Details
Closed on
Feb 17, 2006
Sold by
Chicago Title Land Trust Co
Bought by
Astor Properties Group Llc
Home Financials for this Owner
Home Financials are based on the most recent Mortgage that was taken out on this home.
Original Mortgage
$165,000
Interest Rate
7.5%
Mortgage Type
Construction
Create a Home Valuation Report for This Property
The Home Valuation Report is an in-depth analysis detailing your home's value as well as a comparison with similar homes in the area
Home Values in the Area
Average Home Value in this Area
Purchase History
| Date | Buyer | Sale Price | Title Company |
|---|---|---|---|
| Chicago Residential Properties Llc | -- | Chicago Title | |
| Clyde #7752 Land Trust | -- | Ctic | |
| Astor Properties Group Llc | $85,000 | Pntn |
Source: Public Records
Mortgage History
| Date | Status | Borrower | Loan Amount |
|---|---|---|---|
| Previous Owner | Clyde #7752 Land Trust | $200,000 | |
| Previous Owner | Astor Properties Group Llc | $165,000 |
Source: Public Records
Tax History
| Year | Tax Paid | Tax Assessment Tax Assessment Total Assessment is a certain percentage of the fair market value that is determined by local assessors to be the total taxable value of land and additions on the property. | Land | Improvement |
|---|---|---|---|---|
| 2025 | $2,701 | $17,785 | $3,750 | $14,035 |
| 2024 | $2,701 | $17,785 | $3,750 | $14,035 |
| 2023 | $2,624 | $12,758 | $6,250 | $6,508 |
| 2022 | $2,624 | $12,758 | $6,250 | $6,508 |
| 2021 | $2,565 | $12,758 | $6,250 | $6,508 |
| 2020 | $3,569 | $16,022 | $4,500 | $11,522 |
| 2019 | $3,577 | $17,803 | $4,500 | $13,303 |
| 2018 | $3,517 | $17,803 | $4,500 | $13,303 |
| 2017 | $3,533 | $16,413 | $4,000 | $12,413 |
| 2016 | $3,287 | $16,413 | $4,000 | $12,413 |
| 2015 | $2,436 | $16,413 | $4,000 | $12,413 |
| 2014 | $2,139 | $14,230 | $3,500 | $10,730 |
| 2013 | $2,588 | $14,230 | $3,500 | $10,730 |
Source: Public Records
Map
Nearby Homes
- 7724 S Chappel Ave
- 7718 S Jeffery Blvd Unit GN
- 7720 S Jeffery Blvd Unit 1S
- 7655 S Clyde Ave
- 7816 S Jeffery Blvd
- 7830 S Merrill Ave
- 7642 S Merrill Ave
- 7716 S Paxton Ave
- 7804 S Paxton Ave
- 7832 S Paxton Ave
- 7629 S Euclid Ave
- 2150 E 79th St
- 7643 S Paxton Ave
- 7847 S Bennett Ave
- 7745 S Luella Ave
- 7717 S Luella Ave
- 7759 S Constance Ave
- 7915 S Paxton Ave
- 2052 E 80th St
- 7526 S Merrill Ave
- 7744 S Clyde Ave
- 7754 S Clyde Ave
- 7742 S Clyde Ave
- 7758 S Clyde Ave
- 7740 S Clyde Ave
- 7738 S Clyde Ave
- 7751 S Chappel Ave
- 7755 S Chappel Ave
- 7745 S Chappel Ave
- 7741 S Chappel Ave
- 7732 S Clyde Ave Unit 1
- 7759 S Chappel Ave
- 7739 S Chappel Ave
- 7749 S Clyde Ave Unit 2
- 7749 S Clyde Ave
- 7745 S Clyde Ave
- 7743 S Clyde Ave Unit 2
- 7800 S Clyde Ave
- 7751 S Clyde Ave Unit 2
- 7751 S Clyde Ave
Your Personal Tour Guide
Ask me questions while you tour the home.