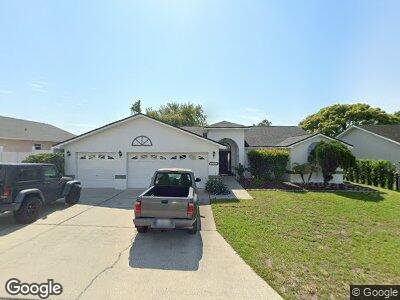
7756 Leighton Cir New Port Richey, FL 34654
River Ridge NeighborhoodEstimated Value: $312,000 - $337,000
3
Beds
2
Baths
1,675
Sq Ft
$194/Sq Ft
Est. Value
About This Home
This home is located at 7756 Leighton Cir, New Port Richey, FL 34654 and is currently estimated at $324,801, approximately $193 per square foot. 7756 Leighton Cir is a home located in Pasco County with nearby schools including River Ridge High School, Cypress Elementary School, and River Ridge Middle School.
Ownership History
Date
Name
Owned For
Owner Type
Purchase Details
Closed on
Feb 21, 2012
Sold by
Vanleuven Donald Earl
Bought by
Smith Ryan B
Current Estimated Value
Purchase Details
Closed on
Apr 3, 2009
Sold by
Mydock Richard G and Mydock Mary A
Bought by
Vanleuven Donald Earl and Van Leuven Mary Susan Smith
Purchase Details
Closed on
Mar 12, 1998
Sold by
Kirk Thomas and Kirk Joyce
Bought by
Mydock Richard G and Mydock Mary A
Purchase Details
Closed on
Dec 21, 1995
Sold by
Deer James R and Deer Anamae
Bought by
Kirk Thomas and Kirk Joyce H
Home Financials for this Owner
Home Financials are based on the most recent Mortgage that was taken out on this home.
Original Mortgage
$69,000
Interest Rate
7.33%
Mortgage Type
New Conventional
Purchase Details
Closed on
Oct 13, 1993
Sold by
Frank John P
Bought by
Deer James R and Deer Anamae H
Home Financials for this Owner
Home Financials are based on the most recent Mortgage that was taken out on this home.
Original Mortgage
$60,000
Interest Rate
6.99%
Mortgage Type
Purchase Money Mortgage
Create a Home Valuation Report for This Property
The Home Valuation Report is an in-depth analysis detailing your home's value as well as a comparison with similar homes in the area
Home Values in the Area
Average Home Value in this Area
Purchase History
| Date | Buyer | Sale Price | Title Company |
|---|---|---|---|
| Smith Ryan B | -- | Attorney | |
| Vanleuven Donald Earl | $134,500 | Capstone Title Llc | |
| Mydock Richard G | $95,500 | -- | |
| Kirk Thomas | $95,500 | -- | |
| Deer James R | $17,900 | -- |
Source: Public Records
Mortgage History
| Date | Status | Borrower | Loan Amount |
|---|---|---|---|
| Previous Owner | Kirk Thomas | $69,000 | |
| Previous Owner | Deer James R | $60,000 |
Source: Public Records
Tax History Compared to Growth
Tax History
| Year | Tax Paid | Tax Assessment Tax Assessment Total Assessment is a certain percentage of the fair market value that is determined by local assessors to be the total taxable value of land and additions on the property. | Land | Improvement |
|---|---|---|---|---|
| 2024 | $4,649 | $294,386 | $64,960 | $229,426 |
| 2023 | $4,444 | $301,136 | $59,080 | $242,056 |
| 2022 | $3,600 | $247,486 | $49,280 | $198,206 |
| 2021 | $3,154 | $192,746 | $44,210 | $148,536 |
| 2020 | $2,827 | $166,295 | $32,795 | $133,500 |
| 2019 | $2,759 | $160,743 | $32,795 | $127,948 |
| 2018 | $2,555 | $147,924 | $32,795 | $115,129 |
| 2017 | $2,409 | $136,289 | $25,865 | $110,424 |
| 2016 | $2,293 | $129,847 | $25,865 | $103,982 |
| 2015 | $2,161 | $119,417 | $25,865 | $93,552 |
| 2014 | $1,976 | $111,028 | $24,465 | $86,563 |
Source: Public Records
Map
Nearby Homes
- 7748 Leighton Cir
- 10316 Alberta Ct
- 7923 Leighton Cir
- 10319 Widgeon Way
- 7536 Roland Ct
- 7530 Roy Ct
- 7612 Tolar Dr
- 7703 Rockville Ct
- 7427 Baltusrol Dr
- 7421 Baltusrol Dr
- 10235 Maverick St
- 10806 Brookhaven Dr
- 10321 Ravines Dr
- 7402 America Way
- 7635 Bloomingdale Dr
- 10908 Claymont Dr
- 10906 New Brighton Ct
- 7941 Clarendon Dr
- 10926 New Brighton Ct
- 7208 Baltusrol Dr
- 7756 Leighton Cir
- 7804 Leighton Cir
- 7803 Leighton Cir
- 7740 Leighton Cir
- 7812 Leighton Cir
- 7751 Leighton Cir
- 7730 Leighton Cir
- 7820 Leighton Cir
- 7809 Leighton Cir
- 7821 Leighton Cir
- 7720 Leighton Cir
- 7830 Leighton Cir
- 7815 Leighton Cir
- 10341 Alberta Ct
- 7827 Leighton Cir
- 7710 Leighton Cir
- 10333 Alberta Ct
- 7835 Leighton Cir
- 7709 Abbott Ct
- 7700 Leighton Cir