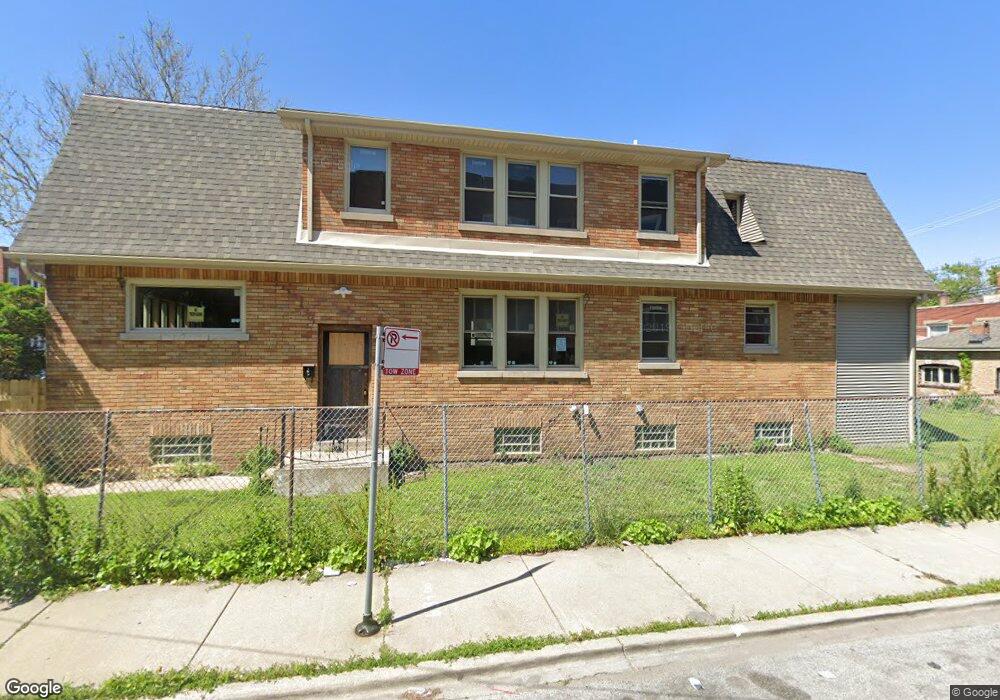
7759 S Ridgeland Ave Unit 1 Chicago, IL 60649
South Shore NeighborhoodEstimated Value: $304,506 - $386,000
4
Beds
2
Baths
3,073
Sq Ft
$113/Sq Ft
Est. Value
About This Home
This home is located at 7759 S Ridgeland Ave Unit 1, Chicago, IL 60649 and is currently estimated at $346,502, approximately $112 per square foot. 7759 S Ridgeland Ave Unit 1 is a home located in Cook County with nearby schools including Mann Elementary School, St Paul Lutheran School, and Muhammad University.
Ownership History
Date
Name
Owned For
Owner Type
Purchase Details
Closed on
Feb 14, 2017
Sold by
Lakeview Loan Servicing Llc
Bought by
Attaboy Construction Llc
Current Estimated Value
Purchase Details
Closed on
Dec 5, 2016
Sold by
Scott Octavia
Bought by
Lakeview Loan Servicing Llc
Purchase Details
Closed on
Nov 21, 2014
Sold by
Prospect Mortgage Llc
Bought by
Prospect Mortgage Llc
Purchase Details
Closed on
Oct 21, 2013
Sold by
Grant Sharon T and Jones Birdia M
Bought by
Scott Antwaun and Scott Octavia
Home Financials for this Owner
Home Financials are based on the most recent Mortgage that was taken out on this home.
Original Mortgage
$216,015
Interest Rate
5.25%
Mortgage Type
FHA
Purchase Details
Closed on
Sep 14, 2013
Sold by
Jones Sam J
Bought by
Scott Antwaun and Scott Octavia
Home Financials for this Owner
Home Financials are based on the most recent Mortgage that was taken out on this home.
Original Mortgage
$216,015
Interest Rate
5.25%
Mortgage Type
FHA
Create a Home Valuation Report for This Property
The Home Valuation Report is an in-depth analysis detailing your home's value as well as a comparison with similar homes in the area
Home Values in the Area
Average Home Value in this Area
Purchase History
| Date | Buyer | Sale Price | Title Company |
|---|---|---|---|
| Attaboy Construction Llc | $38,500 | Attorney | |
| Lakeview Loan Servicing Llc | -- | None Available | |
| Prospect Mortgage Llc | -- | None Available | |
| Scott Antwaun | $40,960 | Attorneys Title Guaranty Fun | |
| Scott Antwaun | -- | Attorneys Title Guaranty Fun |
Source: Public Records
Mortgage History
| Date | Status | Borrower | Loan Amount |
|---|---|---|---|
| Previous Owner | Scott Antwaun | $216,015 |
Source: Public Records
Tax History Compared to Growth
Tax History
| Year | Tax Paid | Tax Assessment Tax Assessment Total Assessment is a certain percentage of the fair market value that is determined by local assessors to be the total taxable value of land and additions on the property. | Land | Improvement |
|---|---|---|---|---|
| 2024 | $4,591 | $22,200 | $2,659 | $19,541 |
| 2023 | $4,438 | $25,000 | $4,431 | $20,569 |
| 2022 | $4,438 | $25,000 | $4,431 | $20,569 |
| 2021 | $4,357 | $24,999 | $4,431 | $20,568 |
| 2020 | $3,068 | $16,875 | $3,190 | $13,685 |
| 2019 | $3,767 | $18,750 | $3,190 | $15,560 |
| 2018 | $3,704 | $18,750 | $3,190 | $15,560 |
| 2017 | $4,886 | $22,696 | $2,836 | $19,860 |
| 2016 | $4,546 | $22,696 | $2,836 | $19,860 |
| 2015 | $3,398 | $18,543 | $2,836 | $15,707 |
| 2014 | $3,044 | $16,406 | $2,481 | $13,925 |
| 2013 | $2,984 | $16,406 | $2,481 | $13,925 |
Source: Public Records
Map
Nearby Homes
- 7743 S East End Ave
- 7842 S Ridgeland Ave
- 7730 S East End Ave
- 7759 S Constance Ave
- 7747 S Cornell Ave
- 1758 E 79th St
- 7650 S Cregier Ave
- 7637 S Ridgeland Ave
- 7627 S Ridgeland Ave
- 7846 S Bennett Ave
- 7931 S East End Ave
- 7631 S Cornell Ave
- 7627 S Cornell Ave
- 7545 S Ridgeland Ave
- 7959 S Constance Ave
- 8005 S Ridgeland Ave
- 7816 S Jeffery Blvd
- 7828 S Jeffery Blvd
- 7943 S Bennett Ave
- 7718 S Jeffery Blvd Unit GN
- 7759 S Ridgeland Ave
- 7755 S Ridgeland Ave
- 7755 S Ridgeland Ave
- 7753 S Ridgeland Ave
- 7749 S Ridgeland Ave
- 7801 S Ridgeland Ave Unit 3
- 7801 S Ridgeland Ave
- 7745 S Ridgeland Ave
- 7743 S Ridgeland Ave
- 7807 S Ridgeland Ave
- 1751 E 78th St Unit 1E
- 7800 S Cregier Ave
- 7811 S Ridgeland Ave
- 7746 S Cregier Ave
- 7758 S Ridgeland Ave
- 7754 S Ridgeland Ave
- 1755 E 78th St Unit 3
- 7750 S Ridgeland Ave
- 7737 S Ridgeland Ave
- 7742 S Cregier Ave