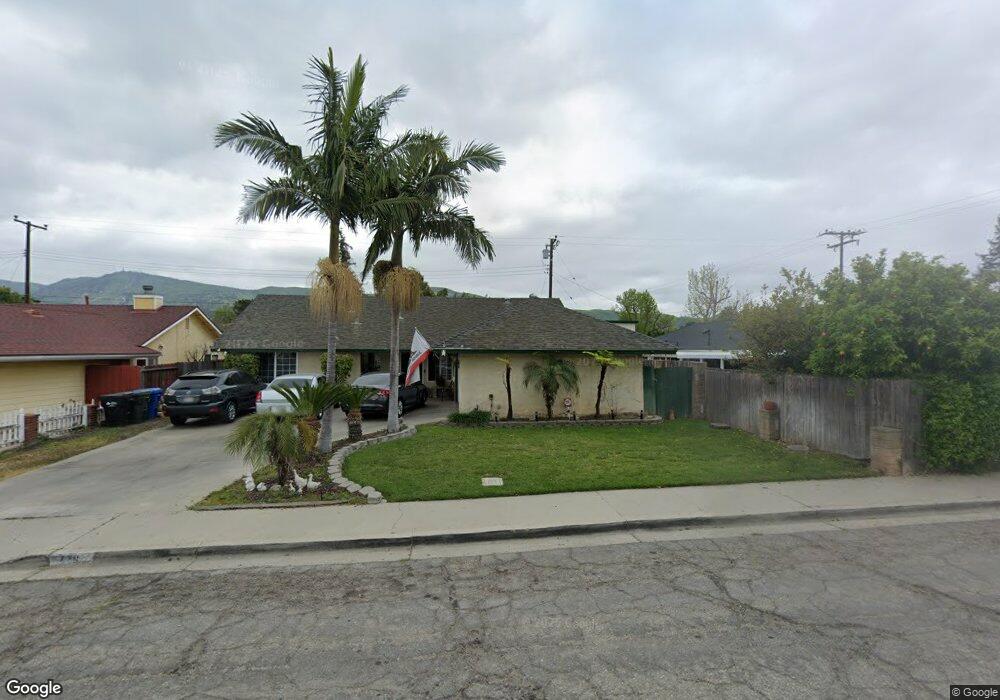
776 Fillmore St Santa Paula, CA 93060
Estimated Value: $672,033 - $826,000
4
Beds
2
Baths
1,369
Sq Ft
$535/Sq Ft
Est. Value
About This Home
This home is located at 776 Fillmore St, Santa Paula, CA 93060 and is currently estimated at $732,508, approximately $535 per square foot. 776 Fillmore St is a home located in Ventura County with nearby schools including Blanchard Elementary School, Isbell Middle, and Santa Paula High.
Ownership History
Date
Name
Owned For
Owner Type
Purchase Details
Closed on
Apr 23, 2020
Sold by
Villa Carlos A
Bought by
Villa Carlos A and Padilla Juan R
Current Estimated Value
Purchase Details
Closed on
Aug 19, 2016
Sold by
Padilla Martina
Bought by
Villa Carlos A
Home Financials for this Owner
Home Financials are based on the most recent Mortgage that was taken out on this home.
Original Mortgage
$245,000
Interest Rate
3.42%
Mortgage Type
New Conventional
Purchase Details
Closed on
Sep 30, 1999
Sold by
Peter Ringle
Bought by
Villa Carlos A and Padilla Martina
Home Financials for this Owner
Home Financials are based on the most recent Mortgage that was taken out on this home.
Original Mortgage
$184,899
Interest Rate
7.68%
Mortgage Type
FHA
Purchase Details
Closed on
Nov 24, 1993
Sold by
Vasquez Felipe A and Vasquez Gloria M
Bought by
Ringle Peter
Home Financials for this Owner
Home Financials are based on the most recent Mortgage that was taken out on this home.
Original Mortgage
$148,320
Interest Rate
7.1%
Mortgage Type
FHA
Create a Home Valuation Report for This Property
The Home Valuation Report is an in-depth analysis detailing your home's value as well as a comparison with similar homes in the area
Home Values in the Area
Average Home Value in this Area
Purchase History
| Date | Buyer | Sale Price | Title Company |
|---|---|---|---|
| Villa Carlos A | -- | None Listed On Document | |
| Villa Carlos A | -- | Stewart Title | |
| Villa Carlos A | $190,500 | Fidelity National Title | |
| Ringle Peter | $150,000 | Chicago Title Co |
Source: Public Records
Mortgage History
| Date | Status | Borrower | Loan Amount |
|---|---|---|---|
| Previous Owner | Villa Carlos A | $245,000 | |
| Previous Owner | Villa Carlos A | $184,899 | |
| Previous Owner | Ringle Peter | $148,320 | |
| Closed | Villa Carlos A | $5,710 |
Source: Public Records
Tax History Compared to Growth
Tax History
| Year | Tax Paid | Tax Assessment Tax Assessment Total Assessment is a certain percentage of the fair market value that is determined by local assessors to be the total taxable value of land and additions on the property. | Land | Improvement |
|---|---|---|---|---|
| 2025 | $3,378 | $292,524 | $117,007 | $175,517 |
| 2024 | $3,378 | $286,789 | $114,713 | $172,076 |
| 2023 | $3,308 | $281,166 | $112,464 | $168,702 |
| 2022 | $3,214 | $275,653 | $110,258 | $165,395 |
| 2021 | $3,204 | $270,249 | $108,097 | $162,152 |
| 2020 | $3,190 | $267,481 | $106,990 | $160,491 |
| 2019 | $3,016 | $262,238 | $104,893 | $157,345 |
| 2018 | $2,979 | $257,097 | $102,837 | $154,260 |
| 2017 | $3,013 | $252,057 | $100,821 | $151,236 |
| 2016 | $2,757 | $247,116 | $98,845 | $148,271 |
| 2015 | $2,634 | $243,406 | $97,361 | $146,045 |
| 2014 | $2,675 | $238,639 | $95,454 | $143,185 |
Source: Public Records
Map
Nearby Homes
- 752 Fillmore St
- 605 Elfred Ct
- 747 Southwick St
- 975 W Telegraph Rd Unit 34
- 975 W Telegraph Rd Unit 126
- 975 W Telegraph Rd Unit 40
- 710 W Harvard Blvd Unit 46
- 525 W Santa Barbara St
- 0 Foothill Rd
- 342 Princeton St
- 545 W Santa Paula St
- 352 Moultrie Place
- 257 Corte Linda
- 265 S Beckwith Rd Unit 57
- 362 W Santa Barbara St
- 324 W Santa Barbara St
- 535 Ridgecrest Dr
- 612 Shasta Dr
- 428 Anacapa Terrace
- 15433 W Telegraph Rd Unit 64
- 768 Fillmore St
- 105 N Peck Rd
- 760 Fillmore St
- 117 N Peck Rd
- 775 Fillmore St
- 767 Fillmore St
- 759 Fillmore St
- 104 N Peck Rd
- 747 Fillmore St
- 744 Fillmore St
- 110 N Peck Rd
- 128 Peck Place
- 116 N Peck Rd
- 736 Fillmore St
- 120 N Peck Rd
- 140 Peck Place
- 0 Peck and Foothill Rd Unit CRV1-3616
- 0 Peck and Foothill Rd Unit V1-3616
- 0 Peck and Foothill Rd Unit 220002196
- 0 Peck and Foothill Rd