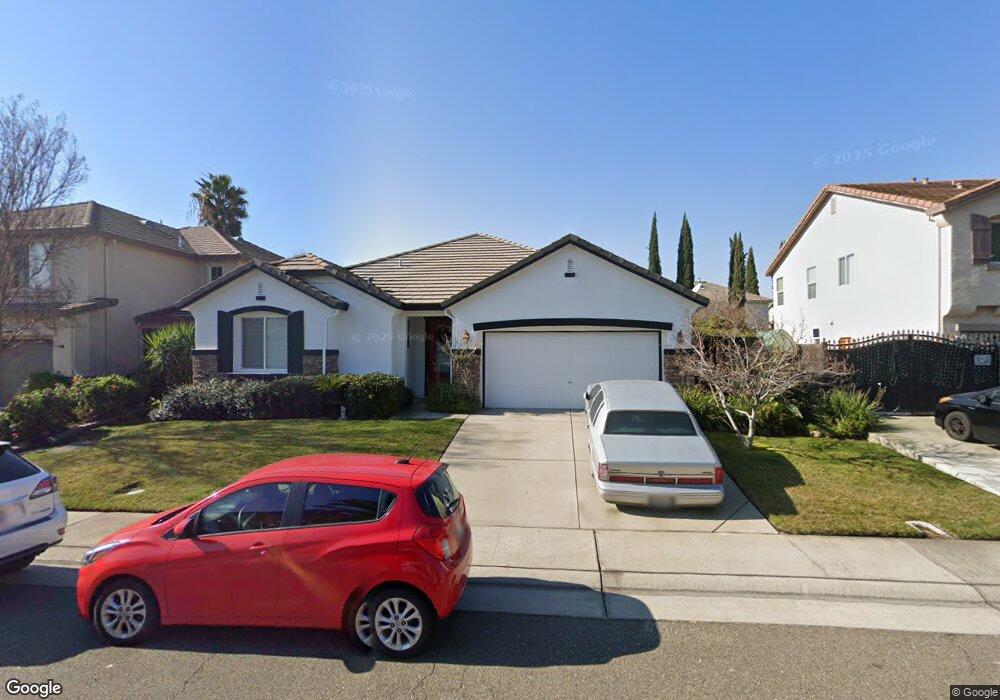
7763 Mist Trail Way Antelope, CA 95843
Estimated Value: $557,000 - $633,000
3
Beds
2
Baths
2,268
Sq Ft
$256/Sq Ft
Est. Value
About This Home
This home is located at 7763 Mist Trail Way, Antelope, CA 95843 and is currently estimated at $580,111, approximately $255 per square foot. 7763 Mist Trail Way is a home located in Sacramento County with nearby schools including Barrett Ranch Elementary School, Antelope Crossing Middle School, and Antelope High School.
Ownership History
Date
Name
Owned For
Owner Type
Purchase Details
Closed on
Aug 18, 2009
Sold by
Chopovenko Vyacheslav and Chopovenko Vyacheslav S
Bought by
Murphy Stephany T
Current Estimated Value
Home Financials for this Owner
Home Financials are based on the most recent Mortgage that was taken out on this home.
Original Mortgage
$247,435
Outstanding Balance
$160,999
Interest Rate
5.17%
Mortgage Type
FHA
Estimated Equity
$419,112
Purchase Details
Closed on
Apr 7, 2009
Sold by
Biancani Al W and Biancani Veralee
Bought by
Chopovenko Vyacheslav
Purchase Details
Closed on
Jun 6, 2003
Sold by
Kb Home North Bay Inc
Bought by
Biancani Al W and Biancani Veralee
Home Financials for this Owner
Home Financials are based on the most recent Mortgage that was taken out on this home.
Original Mortgage
$150,000
Interest Rate
5.37%
Mortgage Type
Purchase Money Mortgage
Create a Home Valuation Report for This Property
The Home Valuation Report is an in-depth analysis detailing your home's value as well as a comparison with similar homes in the area
Home Values in the Area
Average Home Value in this Area
Purchase History
| Date | Buyer | Sale Price | Title Company |
|---|---|---|---|
| Murphy Stephany T | $252,000 | Stewart Title Of Sacramento | |
| Chopovenko Vyacheslav | $200,437 | None Available | |
| Biancani Al W | $283,500 | First American Title Ins Co |
Source: Public Records
Mortgage History
| Date | Status | Borrower | Loan Amount |
|---|---|---|---|
| Open | Murphy Stephany T | $247,435 | |
| Previous Owner | Biancani Al W | $150,000 |
Source: Public Records
Tax History
| Year | Tax Paid | Tax Assessment Tax Assessment Total Assessment is a certain percentage of the fair market value that is determined by local assessors to be the total taxable value of land and additions on the property. | Land | Improvement |
|---|---|---|---|---|
| 2025 | $3,450 | $325,269 | $116,165 | $209,104 |
| 2024 | $3,450 | $318,892 | $113,888 | $205,004 |
| 2023 | $4,223 | $312,640 | $111,655 | $200,985 |
| 2022 | $4,203 | $306,511 | $109,466 | $197,045 |
| 2021 | $4,197 | $300,502 | $107,320 | $193,182 |
| 2020 | $4,149 | $297,422 | $106,220 | $191,202 |
| 2019 | $4,079 | $291,591 | $104,138 | $187,453 |
| 2018 | $3,939 | $285,875 | $102,097 | $183,778 |
| 2017 | $5,184 | $280,271 | $100,096 | $180,175 |
| 2016 | $5,221 | $274,777 | $98,134 | $176,643 |
| 2015 | $3,695 | $270,650 | $96,660 | $173,990 |
| 2014 | $3,626 | $265,349 | $94,767 | $170,582 |
Source: Public Records
Map
Nearby Homes
- 7856 Crestleigh Ct
- 4404 Marvel Ct
- 4448 Garbo Way
- 4421 Bacall Ct
- 7628 Laguna Beach Way
- 7666 Ocean Park Dr
- 7929 Titan Dr
- 8020 Walerga Rd Unit 3
- 8020 Walerga Rd Unit 1009
- 8020 Walerga Rd Unit 1093
- 8020 Walerga Rd
- 7433 Widener Way
- 7531 Event Way
- 4632 Swindon Way
- 4767 Morgan Oak Ct
- 8121 Deer Spring Cir
- 4801 Dover Ln Unit 504
- 7340 Hamden Place Unit 104
- 7340 Hamden Place Unit 107
- 4840 Dover Ln Unit 406
- 7759 Mist Trail Way
- 7767 Mist Trail Way
- 7762 Truffle Ct
- 7755 Mist Trail Way
- 7766 Truffle Ct
- 7758 Truffle Ct
- 7773 Mist Trail Way
- 7762 Mist Trail Way
- 7766 Mist Trail Way
- 7754 Truffle Ct
- 7758 Mist Trail Way
- 7770 Truffle Ct
- 7770 Mist Trail Way
- 7751 Mist Trail Way
- 7754 Mist Trail Way
- 7750 Truffle Ct
- 4553 Winje Dr
- 7774 Mist Trail Way
- 4549 Winje Dr
- 7750 Mist Trail Way
Your Personal Tour Guide
Ask me questions while you tour the home.