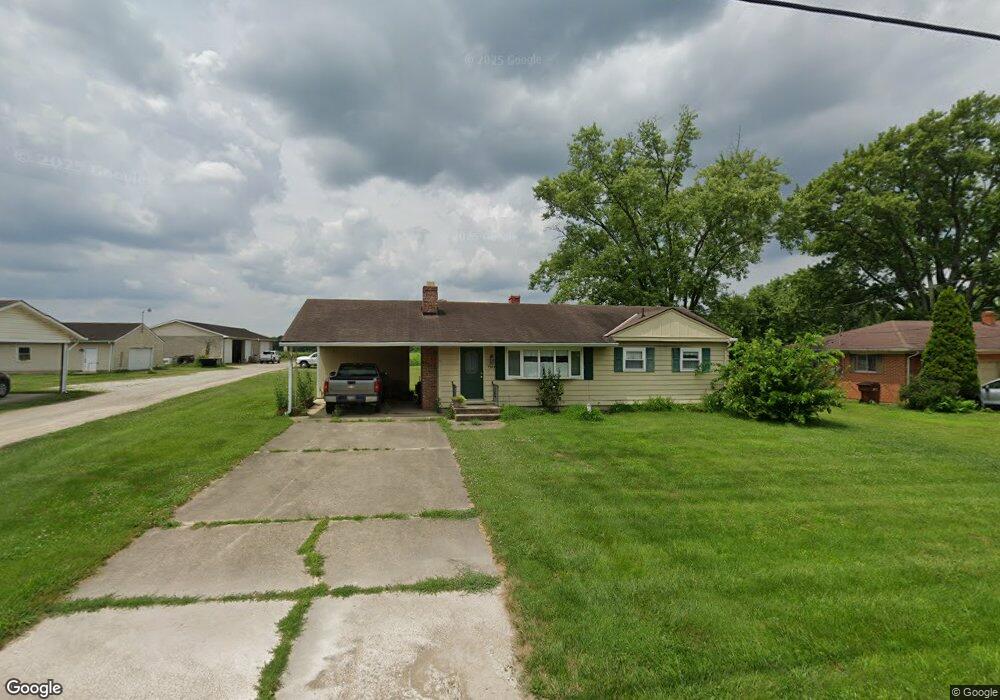
7769 Martz Paulin Rd Franklin, OH 45005
Estimated Value: $130,000 - $185,000
3
Beds
1
Bath
960
Sq Ft
$171/Sq Ft
Est. Value
About This Home
This home is located at 7769 Martz Paulin Rd, Franklin, OH 45005 and is currently estimated at $163,910, approximately $170 per square foot. 7769 Martz Paulin Rd is a home located in Warren County with nearby schools including Alden R Brown Elementary School, Chamberlain Middle School, and Carlisle High School.
Ownership History
Date
Name
Owned For
Owner Type
Purchase Details
Closed on
Jul 13, 2012
Sold by
Pennington Frank W
Bought by
Griffin William and Griffin Janese
Current Estimated Value
Purchase Details
Closed on
May 18, 2012
Sold by
Brewer Jason
Bought by
Pennington Frank W
Purchase Details
Closed on
Aug 17, 2006
Sold by
Climie Jaime and Climie Neal A
Bought by
Brewer Jason
Home Financials for this Owner
Home Financials are based on the most recent Mortgage that was taken out on this home.
Original Mortgage
$77,600
Interest Rate
8.35%
Mortgage Type
Purchase Money Mortgage
Purchase Details
Closed on
Jun 25, 2001
Sold by
South Buford
Bought by
Kennard Jaime
Home Financials for this Owner
Home Financials are based on the most recent Mortgage that was taken out on this home.
Original Mortgage
$85,500
Interest Rate
7.11%
Create a Home Valuation Report for This Property
The Home Valuation Report is an in-depth analysis detailing your home's value as well as a comparison with similar homes in the area
Home Values in the Area
Average Home Value in this Area
Purchase History
We collect this data history from publicly available records. To have your information removed, we recommend requesting removal directly through your county’s website.
| Date | Buyer | Sale Price | Title Company |
|---|---|---|---|
| Griffin William | $30,000 | None Available | |
| Pennington Frank W | $8,000 | None Available | |
| Brewer Jason | $97,000 | Residential Title | |
| Kennard Jaime | $90,000 | -- |
Source: Public Records
Mortgage History
We collect this data history from publicly available records. To have your information removed, we recommend requesting removal directly through your county’s website.
| Date | Status | Borrower | Loan Amount |
|---|---|---|---|
| Previous Owner | Brewer Jason | $77,600 | |
| Previous Owner | Kennard Jaime | $85,500 |
Source: Public Records
Tax History
| Year | Tax Paid | Tax Assessment Tax Assessment Total Assessment is a certain percentage of the fair market value that is determined by local assessors to be the total taxable value of land and additions on the property. | Land | Improvement |
|---|---|---|---|---|
| 2025 | $1,586 | $40,090 | $14,290 | $25,800 |
| 2024 | $1,586 | $40,090 | $14,290 | $25,800 |
| 2023 | $1,262 | $29,340 | $7,332 | $22,008 |
| 2022 | $1,254 | $29,341 | $7,333 | $22,008 |
| 2021 | $1,209 | $29,341 | $7,333 | $22,008 |
| 2020 | $1,174 | $24,864 | $6,213 | $18,652 |
| 2019 | $1,189 | $24,864 | $6,213 | $18,652 |
| 2018 | $1,191 | $24,864 | $6,213 | $18,652 |
| 2017 | $1,229 | $23,765 | $5,142 | $18,624 |
| 2016 | $1,076 | $23,765 | $5,142 | $18,624 |
| 2015 | $1,078 | $23,765 | $5,142 | $18,624 |
| 2014 | $1,062 | $23,770 | $5,140 | $18,620 |
| 2013 | $1,059 | $28,710 | $6,210 | $22,500 |
Source: Public Records
Map
Nearby Homes
- 7854 Lowe Dr
- 7869 Dubois Rd
- 8037 Timberwind Trail
- 7426 Martz Paulin Rd
- 8115 Martz-Paulin Rd
- 7548 Timber Valley Dr
- 165 Baker Ln
- 870 Marty Lee Ln
- 155 Vernon Place
- 7442 Timber Valley Dr
- 3008 Doe Dr
- 7332 Country Walk Dr
- 940 Carolyn Ct
- 8653 Twincreek Dr
- 7401 Beth Ct
- 90 Timber Creek Dr
- 8677 Oriole Dr
- 8233 Meadowlark Dr
- 7278 Beth Ct
- 0 Oxford Rd
- 7757 Martz Paulin Rd
- 7787 Martz Paulin Rd
- 7731 Martz Paulin Rd
- 7770 Martz Paulin Rd
- 7823 Martz Paulin Rd
- 7823 Matz Paulin Rd
- 7754 Martz Paulin Rd
- 7788 Martz Paulin Rd
- 7711 Martz Paulin Rd
- 7816 Martz Paulin Rd
- 7726 Martz Paulin Rd
- 8091 Sharon Ct
- 8059 Sharon Ct
- 7693 Martz Paulin Rd
- 7824 Martz Paulin Rd
- 7946 Lowe Dr
- 7708 Martz Paulin Rd
- 7861 Martz Paulin Rd
- 7787 Anne Dr
- 7846 Martz Paulin Rd
Your Personal Tour Guide
Ask me questions while you tour the home.